Australian Wool Production Forecast Report August 2025
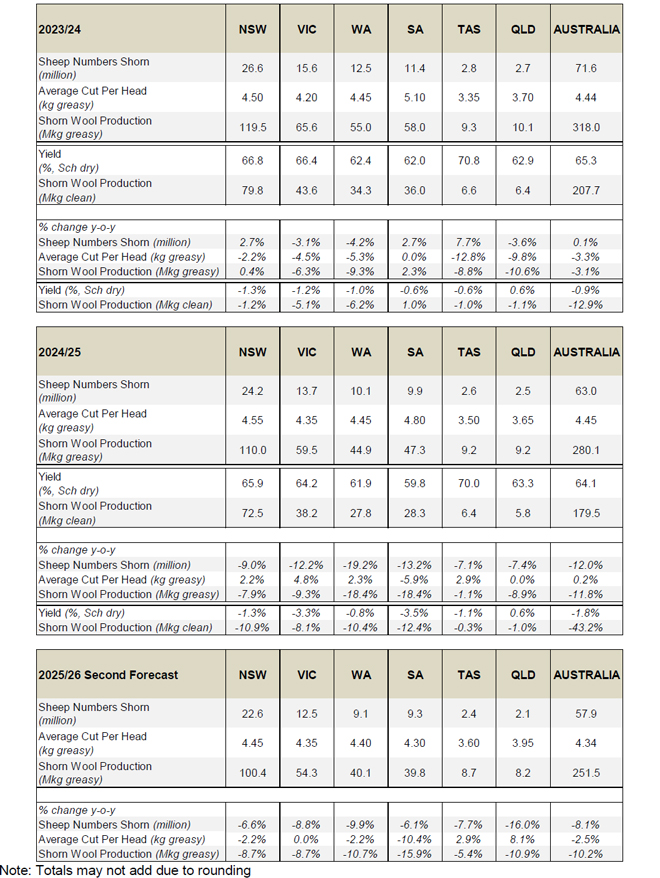
The Australian Wool Production Forecasting Committee’s (AWPFC) estimate of shorn wool production for the 2024/25 season is 280.1 Mkg greasy. This is 11.8% lower than the 2023/24 and confirms the forecast made in April 2025.
Summary
- The Australian Wool Production Forecasting Committee’s (AWPFC) estimate of shorn wool production for the 2024/25 season is 280.1 Mkg greasy. This is 11.8% lower than the 2023/24 and confirms the forecast made in April 2025.
- A year-on-year decline in shorn wool production in 2024/25 was estimated for all states ranging from -18.4% in both WA (44.9 Mkg greasy) and SA (47.3 Mkg greasy) to -1.1% (9.2 Mkg greasy) in Tasmania. NSW produced 110.0 Mkg greasy (down 7.9%), Victoria 59.5 (Mkg greasy (down 9.3%) and Queensland 9.23 Mkg greasy (down 8.9%).
- Average cut per head is forecast to be comparable with 2023/24, at 4.45 kg greasy (up 0.2%). AWTA Key Test Data for the 2024/25 season show small year-on-year reductions in mean fibre diameter (down 0.2 microns), staple strength (down 1.5 N/ktex) and yield (down 1.1%) with a small increase in staple length (up 0.2 mm) and no year-on-year change in vegetable matter (2.2%). These data reflect the difficult seasonal conditions in many states during 2024/25 and the continued dampening impact of the season on average cut per head.
- AWTA wool test volumes for the 2024/25 season were down by 11.7% on a year-on-year basis. Firsthand offered wool at auction during 2024/25 was down by 13.2%.
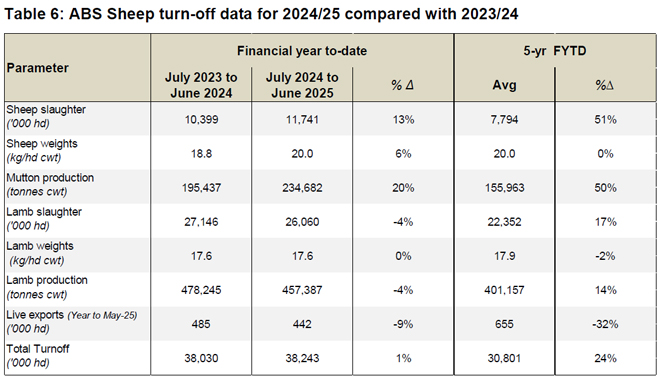
- Sheep slaughter for 2024/25 was up 13% to 11.7 million head with lamb slaughter at 26.1 million head (down 4%) compared to 2023/24. However, the 2024/25 sheep and lamb slaughter were both higher than the five-year average by 51% and 17% respectively.
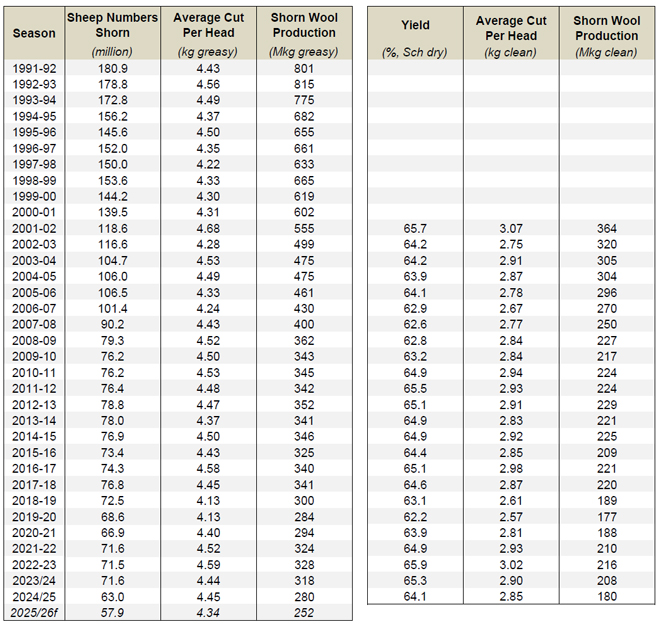
- The August AWPFC estimate includes a clean wool estimate for average cut per head and shorn wool production. For the 2024/25 season the yield (%, Schlumberger dry top and noil yield) from the AWTA key test data was used to calculate the clean average cut per head and clean shorn wool production (Table 1).
- The AWPFC’s second forecast of shorn wool production for the 2025/26 season is 251.5 Mkg greasy, a 10.2% decrease on the 2024/25 forecast. Sheep shorn numbers are forecast to reduce by 8.1% to 57.9 million.
- The May 2025 Sheep Producer Intentions Survey indicated continued negative sentiment among wool producers due to challenging seasonal conditions, increasing input costs, workforce shortage as well as supply chain and market pressures. These factors continue to impact sheep producers’ decisions regarding their overall livestock enterprise mix and the breed composition of their sheep flock.
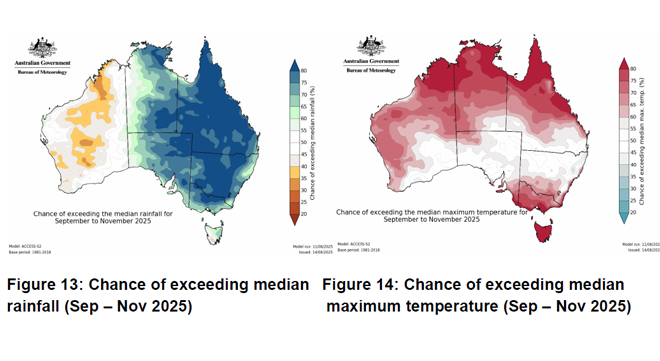
- The Bureau of Meteorology’s outlook for September to November 2025 is for above average median rainfall for most of the eastern half of Australia, but below average rainfall for parts of Western Australia. Above average maximum temperatures are likely to very likely for most key wool producing regions.
- Table 1 summarises Australian wool production and Table 2 shows the total shorn wool production by state. Table 3 provides a comparison of AWTA key test data for the 2024/25 and 2023/24 seasons.
- More detailed information on the shorn wool production by state in 2024/25 can be found in Table A1 in the Appendix to this report.
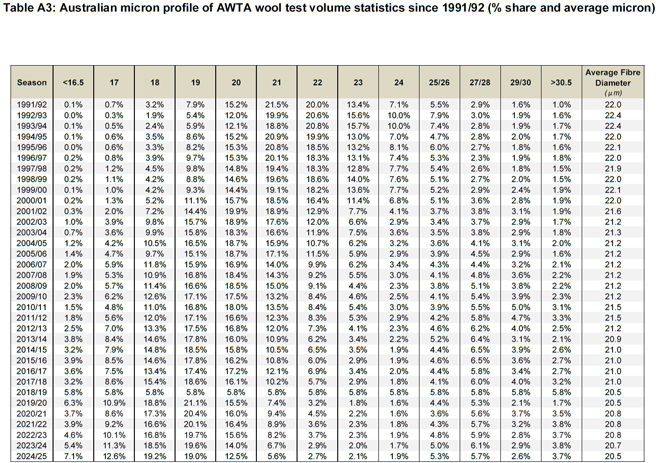
- The Appendix also provides historical data for Australia, including sheep shorn numbers, average cut per head and shorn wool production (Table A2) as well as the micron profile (Table A3) since 1991/92.
Detail on shorn wool production in 2024/25 and the 2025/26 forecast
Major data inputs
The AWPFC forecasts are based on detailed consideration by the state and national committees of data from various sources including:
- AWTA wool test data for the 2024/25 season and 2025/26 to July 2025;
- AWEX first-hand auction statistics for the 2024/25 season and 2025/26 to July 2025 (Week 4);
- ABS sheep and lamb turn-off for the 2024/25 season;
- Information on current and expected seasonal conditions from the Bureau of Meteorology
- Survey information from the MLA/AWI Sheep Producer Intentions Survey conducted in May 2025.
AWTA wool test data
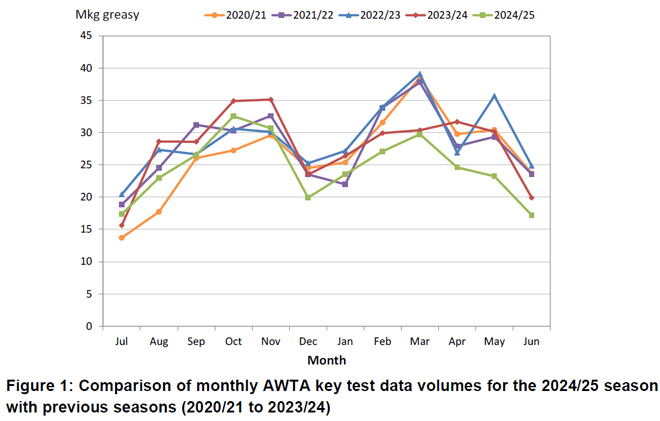
Every month AWTA releases data on the volumes of greasy wool tested within the various diameter categories for the month and the season to date. Data for the 2024/25 season are compared with previous seasons (2020/21 to 2023/24) in this report.
The month-by-month comparison of wool tested during the 2024/25 season show test volumes close to the five-year average from July to November 2024 (Figure 1). Apart from January 2025, test volumes from December 2024 to June 2025 were the lowest for the past four seasons.
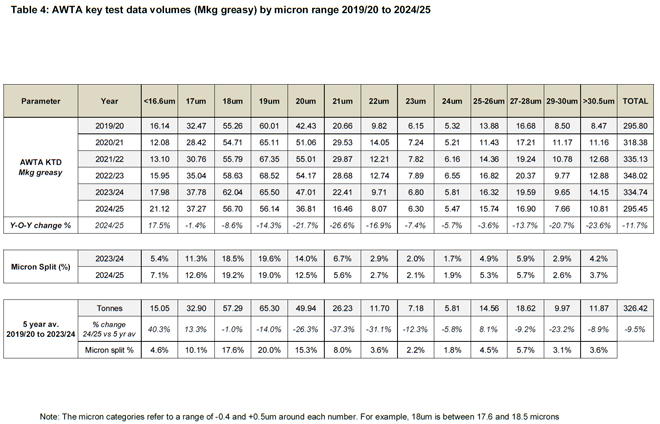
AWTA national wool test volumes data for the 2024/25 season (Table 4) show:
- Volumes of wool tested were 11.7% lower than the 2023/24 season at 295.45 Mkg greasy. This was 9.5% lower than the five-year average from 2019/20 to 2023/24.
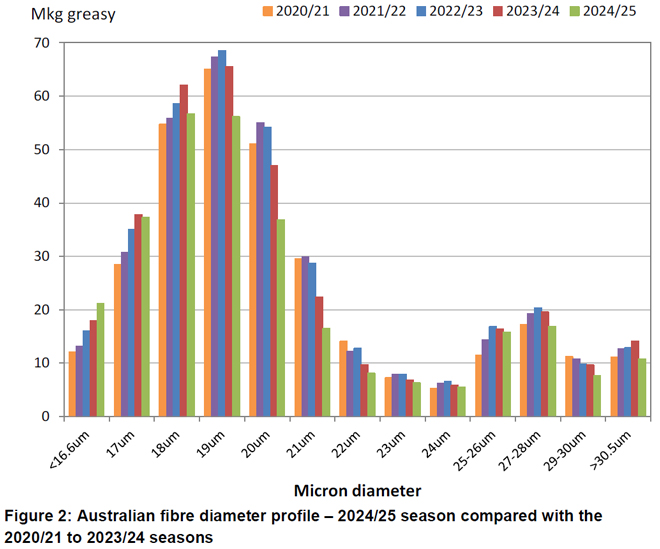
- Apart from the less than 16.6 microns category which was up 17.5%, the weight of wool tested in all other micron categories, decreased by between 1.4% (17 microns) and 26.6% (21 microns).
- The largest micron categories by volume were the 18-micron (56.7 Mkg greasy), 19-micron (56.1 Mkg greasy) and 17-micron (37.3 Mkg greasy) categories.
- The micron split (% of total weight of wool tested) during 2024/25 showed small increases in the finer (i.e. less than 18 microns) end of the micron range. The difference across the micron categories in comparison to the 2023/24 season ranged from -1.6% (20 microns) to +1.8% (less than 16.6 microns).
The micron profile of the Australian wool clip continues to have two distinct peaks. One centred around 18- to 19-micron wool (finer than 16.6 microns up to 23 microns) and a second centred around 26 - 28 microns (from 24 microns to 30.5 microns and broader) (Figure 2).
A historical comparison of the Australian wool clip’s micron profile percentage share and average micron can be found in Appendix Table A3 (at the end of this report).
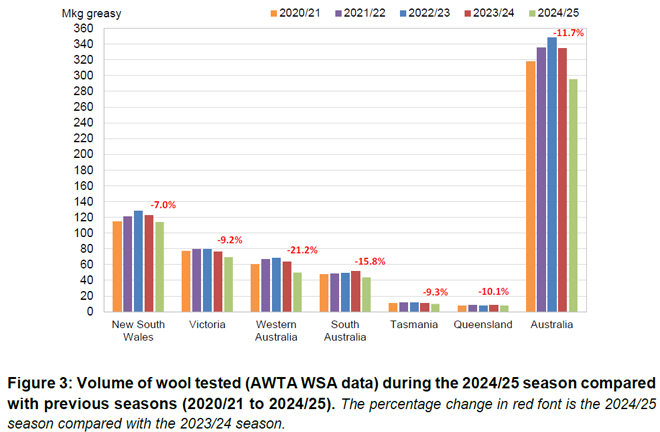
Based on data by Wool Statistical Area (WSA), the volumes of wool tested during 2024/25 decreased in all states (Figure 3). Western Australia had the greatest decrease in the volume of wool tested (down 21.2%), followed by South Australia (down 15.8%), Queensland (down 10.1%), Tasmania (down 9.3%), Victoria (down 9.2%) and New South Wales (down 7.0%).
In New South Wales, the greatest volumes of wool tested originated from WSA regions N23 (16.4%), N19 (7.3%), N29 (6.3%), N15 (6.0%) and N24 (5.2%) (Figure 4a). Collectively, these five WSAs represented 41.3% of the total weight of wool tested in New South Wales during 2024/25 (Figure 4b).
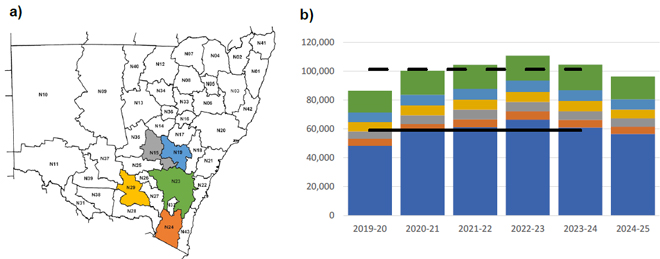
Figure 4: a) The five New South Wales WSA regions from which the greatest volumes of wool tested originated and b) The total wool test volumes for the 2024/25 season compared with previous seasons (2019/20 to 2023/24). The larger blue portion of each column represents the other WSA regions with the coloured bars representing the 5 largest WSA regions: green; light blue; yellow; grey & orange. The continuous black horizontal line represents the 5-year average from 2019/20 to 2023/24 for the other WSAs with the dashed black line the five-year average for the state. Data is in greasy tonnes.
In Victoria, the greatest volumes of wool tested originated from WSA regions V21 (13.2%), V18 (11.2%), V07 (10.8%), V22 (9.2%) and V25 (7.8%) (Figure 5a). Collectively, these five WSAs represented 52.1% of the total weight of wool tested in Victoria during 2024/25 (Figure 5b).
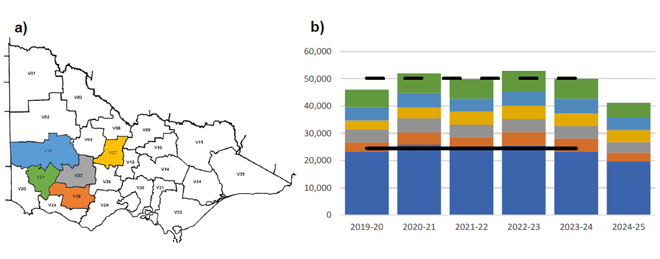
Figure 5: a) The five Victorian WSA regions from which the greatest volumes of wool tested originated and b) The total wool test volumes for the 2024/25 season compared with previous seasons (2019/20 to 2023/24). The larger blue portion of each column represents the other WSA regions with the coloured bars representing the 5 largest WSA regions: green; light blue; yellow; grey & orange. The continuous black horizontal line represents the 5-year average from 2019/20 to 2023/24 for the other WSAs with the dashed black line the five-year average for the state. Data is in greasy tonnes.
In Western Australia, the greatest volumes of wool tested originated from WSA regions W12 (20.1%), W09 (17.8%), W10 (13.5%), W11 (8.3%) and W08 (8.2%) (Figure 6a). Collectively, these five WSAs represented 68.0% of the total weight of wool tested in Western Australia during 2024/25 (Figure 6b).
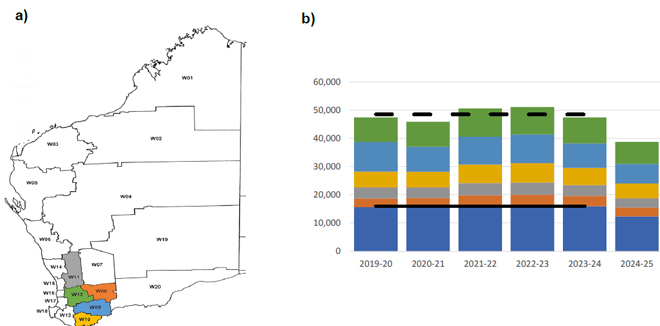
Figure 6: a) The five Western Australian WSA regions from which the greatest volumes of wool tested originated and b) The total wool test volumes for the 2024/25 season compared with previous seasons (2019/20 to 2023/24). The larger blue portion of each column represents the other WSA regions with the coloured bars representing the 5 largest WSA regions: green; light blue; yellow; grey & orange. The continuous black horizontal line represents the 5-year average from 2019/20 to 2023/24 for the other WSAs with the dashed black line the five-year average for the state. Data is in greasy tonnes.
In South Australia, the greatest volumes of wool tested originated from WSA regions S29 (18.0%), S15 (9.4%), S06 (8.4%), S13 (8.3%) and S30 (6.8%) (Figure 7a). Collectively, these five WSAs represented 50.9% of the total weight of wool tested in South Australia during 2024/25 (Figure 7b).
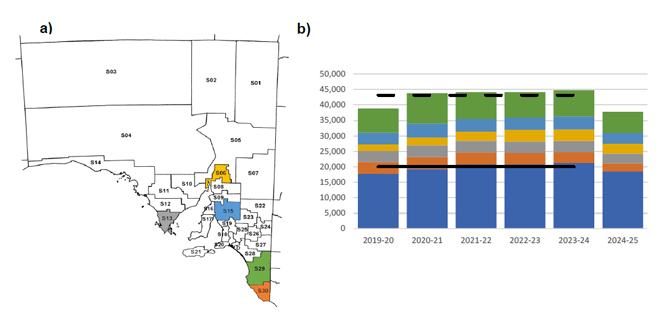
Figure 7: a) The five South Australian WSA regions from which the greatest volumes of wool tested originated and b) The total wool test volumes for the 2024/25 season compared with previous seasons (2019/20 to 2023/24). The larger blue portion of each column represents the other WSA regions with the coloured bars representing the 5 largest WSA regions: green; light blue; yellow; grey & orange. The continuous black horizontal line represents the 5-year average from 2019/20 to 2023/24 for the other WSAs with the dashed black line the five-year average for the state. Data is in greasy tonnes.
In Tasmania, the greatest volumes of wool tested originated from WSA regions T05 (33.8%), T03 (26.7%), T04 (25.9%), T06 (9.4%) and T01 (3.3%) (Figure 8a). Collectively, these five WSAs represented 99.2% of the total weight of wool tested in Tasmania during 2024/25 (Figure 8b).
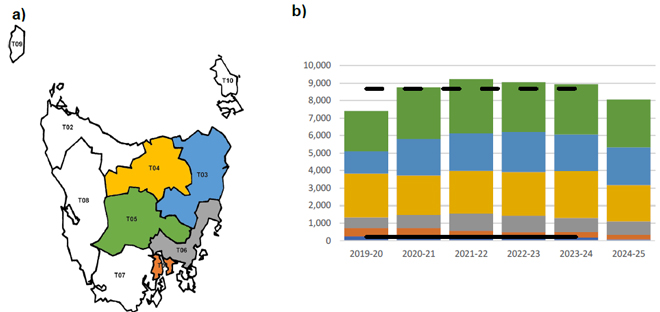
Figure 8: a) The five Tasmanian WSA regions from which the greatest volumes of wool tested originated and b) The total wool test volumes for the 2024/25 season compared with previous seasons (2019/20 to 2023/24). The larger blue portion of each column represents the other WSA regions with the coloured bars representing the 5 largest WSA regions: green; light blue; yellow; grey & orange. The continuous black horizontal line represents the 5-year average from 2019/20 to 2023/24 for the other WSAs with the dashed black line the five-year average for the state. Data is in greasy tonnes.
In Queensland, the greatest volumes of wool tested originated from WSA regions Q12 (21.2%), Q23 (11.6%), Q15 (10.0%), Q21 (8.1%) and Q18 (6.8%) (Figure 9a). Collectively, these five WSAs represented 57.8% of the total weight of wool tested in Queensland during 2024/25 (Figure 9b).
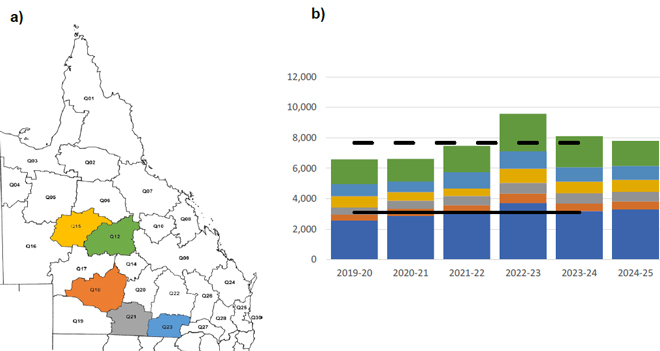
Figure 9: a) The five Queensland WSA regions from which the greatest volumes of wool tested originated and b) The total wool test volumes for the 2024/25 season compared with previous seasons (2019/20 to 2023/24). The larger blue portion of each column represents the other WSA regions with the coloured bars representing the 5 largest WSA regions: green; light blue; yellow; grey & orange. The continuous black horizontal line represents the 5-year average from 2019/20 to 2023/24 for the other WSAs with the dashed black line the five-year average for the state. Data is in greasy tonnes.
A graphical representation of the AWTA Key Test Data changes in mean fibre diameter (MFD), vegetable matter (VM), staple length (SL), yield (YIELD), staple strength (SS) and hauteur (TEAM 3 H) from the 2004/05 to the 2024/25 season is shown in Figure 10. On each graph the red dot represents the mean value of each characteristic for the 2024/25 season while the blue dot represents the mean for the 2023/24 season. The values above the gauge on the left-hand side of each graph show the mean and standard deviation respectively for that characteristic from 2004/05 to 2024/25. Each coloured segment on the gauges represents one standard deviation with the mean at 12 o-clock (centre). For MFD, VM, SL, YIELD and SS, the mean and standard deviation are based on data from the 2004/05 season onwards. For TEAM 3 the mean and standard deviation are based on data from the 2006/07 season onwards. The red line on each gauge is the mean for the 2024/25 season (TY), while the blue line is the mean for the 2023/24 season (LY).
- On a national basis, compared with the 2023/24 season, mean fibre diameter was 20.5 microns down 0.2 microns, staple length was up 0.2 mm to 87.1 mm and staple strength was down 1.5 N/ktex to 33.7 N/ktex (Figure 10a).
- Vegetable matter was unchanged at 2.2%, yield was down 1.2% to 64.1% and predicted hauteur (TEAM 3) was down 0.2 mm to 69.9 mm (Figure 10b).
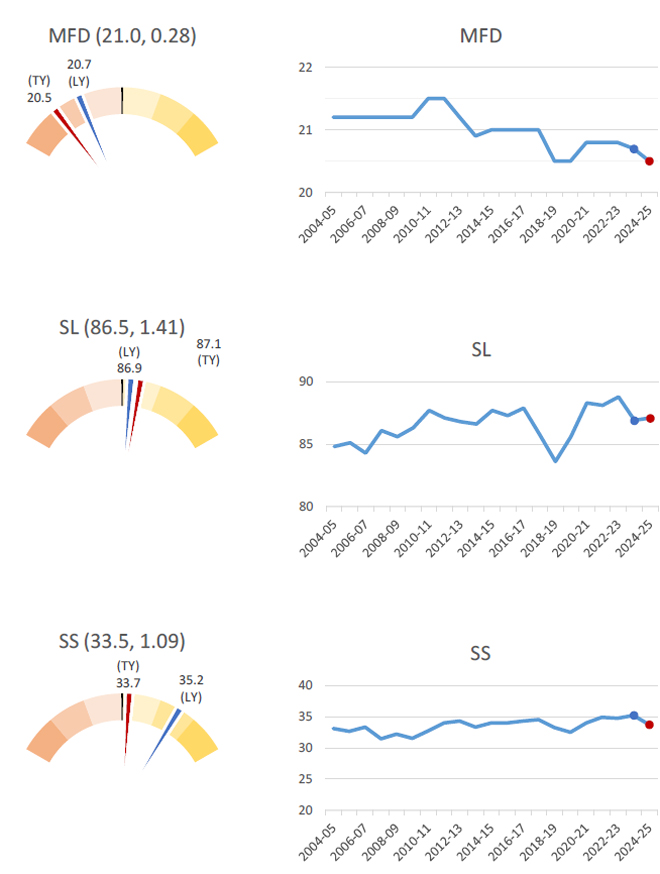
Figure 10a: AWTA Key Test Data mean fibre diameter (MFD), staple length (SL) and staple strength (SS) for the Australian wool clip from 2004/05 to 2024/25
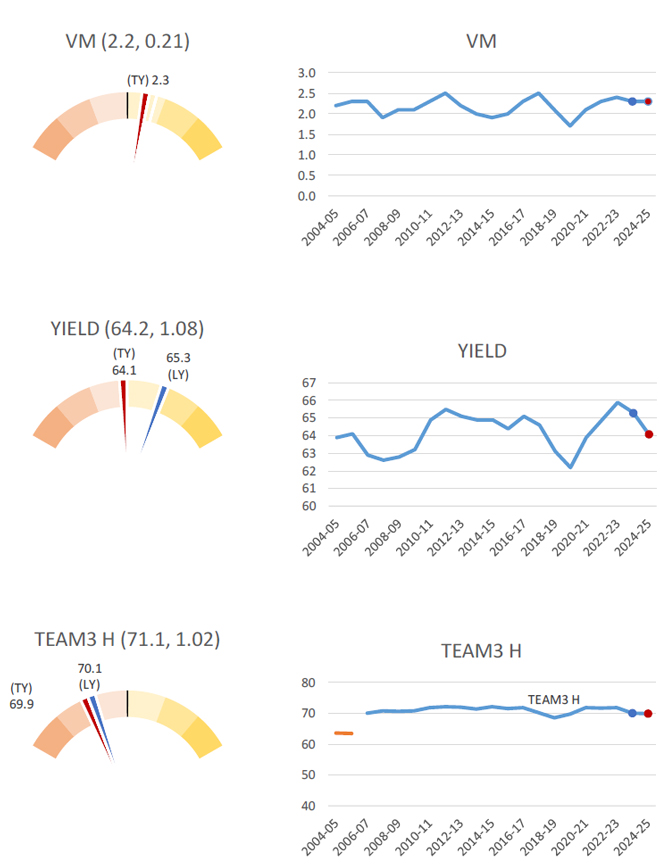
Figure 10b: AWTA Key Test Data vegetable matter (VM), yield (YIELD) and TEAM 3 H (TEAM 3 H) for the Australian wool clip from 2004/05 to 2024/25
AWEX auction statistics
The AWEX first-hand auction statistics for the 2024/25 season were 13.2% lower than the same time in 2023/24 (Table 5).
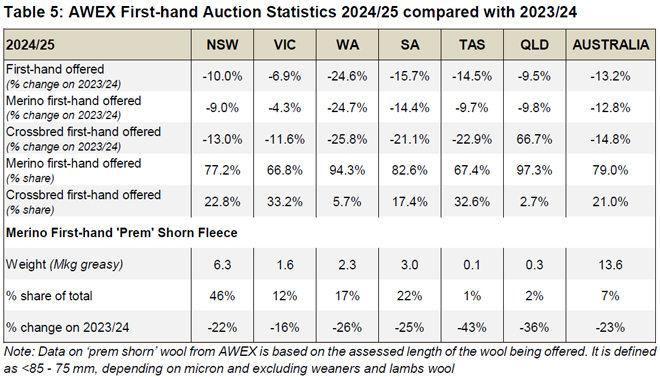
- First-hand bales offered decreased in all states, Western Australia (down 24.6%), South Australia (down 15.7%), Tasmania (down 14.5%), New South Wales (down 10.0%), Queensland (down 9.5%) and Victoria (down 6.9%) (Table 5).
- The volume of first-hand Merino wool offered across Australia decreased by 12.8% with the volume of first-hand Crossbred wool offered down 14.8%. The share of Merino wool of all first-hand offered wool was 79.0% 2024/25, compared with 78.6% in 2023/24 and 78.9% in 2022/23.
- There was a 23% decrease in the volume of ‘Prem-shorn’ Merino fleece wool in 2024/25 (13.6 Mkg) compared with 2023/24 (17.7 Mkg).
- As a percentage share of the total first-hand wool offered, 7% of Australian first-hand bales offered were prem shorn in 2024/25. On a state-by-state basis this ranged from 1% in Tasmania to 46% in New South Wales.
Australian Bureau of Statistics (ABS) data
Sheep turn-off
Australian sheep and lamb turn-off statistics during 2024/25 are shown in Table 6:
- There was a 13% increase in sheep slaughter, and a 4% decrease in lamb slaughter compared with 2023/24.
- Sheep slaughter was 51% above the five-year average with lamb slaughter 17% higher than the five-year average.
- The number of live sheep exported from Australia decreased by 9% compared with 2023/24 and was 32% below the five-year average.
- Total turnoff of sheep and lambs for 2024/25 was 1% higher than 2023/24 and 24% above the five-year average.
Bureau of Meteorology (BoM) seasonal rainfall seasonal outlook
Seasonal conditions during 2024/25 were average to below average in the key wool producing regions in Western Australia, South Australia, New South Wales, Victoria and Tasmania (Figure 11). The major wool producing regions in South Australia and Victoria had very much below average to lowest on record rainfall deciles. The main wool producing regions in New South Wales received average to below average rainfall. Queensland received above average to very much above average rainfall.
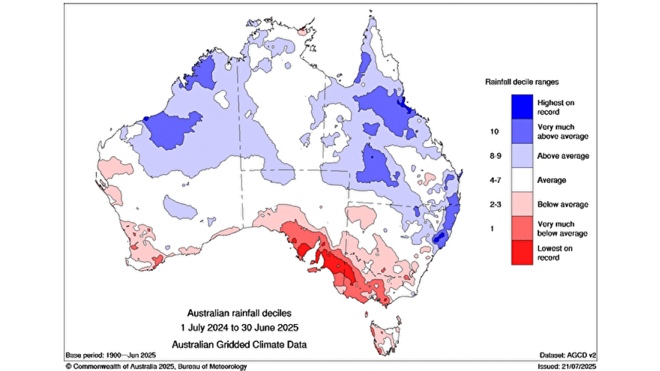
Figure 11: Australian rainfall deciles, 2024/25 season
The landscape water balance in the major wool producing regions reflects seasonal conditions and rainfall (Figure 12).
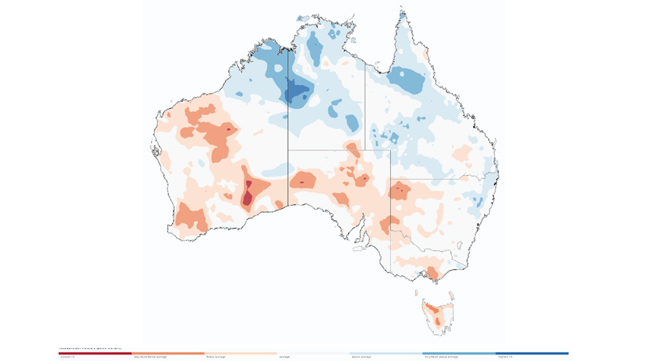
Figure 12: Australian landscape water balance, at 30 June 2025 (Source: Bureau of Meterology)
The Bureau of Meteorology’s outlook for September to November 2025 is for above average median rainfall being likely to very likely (60% to greater than 80% chance) for most of the eastern half of Australia (Figure 13). Below average rainfall is likely (60% to 80% chance) for parts of Western Australia. Above average maximum temperatures are likely to very likely (60% to greater than 80% chance) for most key wool producing regions (Figure 14).
Results from the MLA and AWI Sheep producers Intentions Survey
The May 2025 Sheep Producer Intentions Survey indicated a reduction in producer sentiment regarding the wool industry (-35) down 11 points on May 2024. In comparison, producer sentiment regarding the sheepmeat industry was 48 points higher than May 2024 (4 points).
Nationally, 41% of sheep producers intend to decrease their numbers of breeding ewes from 2025 to 2026, with 23% intending to increase.
The continued negative sentiment among wool producers was due to challenging seasonal conditions, increasing input costs, workforce shortage as well as supply chain and market pressures. These factors continue to impact sheep producers’ decisions regarding their overall livestock enterprise mix and the breed composition of their sheep flock.
State Committee input
The following provides a summary of seasonal conditions and the wool production estimate for 2024/25 and forecast for 2025/26 as reported by the AWPFC state committees in August 2025.
New South Wales
Variable season across New South Wales. The Bureau of Meteorology reported above average rainfall deciles in the northeast, average in central regions and below average in southern and northwest regions. Soil moisture in the root zone mirrored the rainfall decile distribution. Continued pessimism among wool producers in the Northern Tablelands region despite the favourable season due to on-going significant issues with internal parasites and frequent drenching with associated labour requirement and chemical costs outstripping returns. Large numbers of Merino sheep (estimated at 20%) have been sold from the region. This is a permanent decision for Merino producers with a move towards cattle. Flatter country south of the Northern Tablelands are increasing farming with fewer sheep. Producers in many regions are increasing crossbred lamb production at the expense of wool with a 5-10% reduction in Merino shearings, fewer Merino rams offered for sale (down 10%) and an increase in Merino by terminal joinings. An increasingly small proportion of producers are retaining a full self-replacing Merino operation.
Very cold weather in the southwest and central regions during June followed a mild and dry Autumn. Eastern regions have fared better than those further south and the southwest. Sheep were in lean condition, nutrition was limiting which reduced reproductive performance, particularly in the southeast. Prolonged periods of frost slowed pasture growth with feeding continuing as many producers dealt with bare paddocks or limited pasture availability.
High sheep turnoff has continued, driven by high mutton prices. Older (4 to 5-year-old) ewes were sold to capture high mutton prices, rather than joining and selling lamb. Increasing costs remain a significant issue for wool enterprises, given the relative prices for wool and sheepmeat. Shearer availability is no longer an issue, having pivoted to a surplus of shearers due to reduced sheep numbers.
Prem-shearing (at 6- or 8-months) has largely ceased in many regions due to the cost of shearing and processor willingness to take woolly sheep. No significant movement in mean fibre diameter or yield indicate no large change in per head production. The increase in staple length reflects the reduction in prem shearing. The New South Wales Committee’s final estimate of shorn wool production for 2024/25 was 110.0 Mkg greasy, down 7.9% on 2023/24.
Current lambing percentages are lower than average, negatively impacted by the cold weather. Follow-up rain and rising soil temperatures are expected to stimulate pasture growth and may slow down the reduction in stock numbers in regions experiencing tough conditions. Large snowfalls in the northeast will set the region up for a good spring. Improvement in pasture availability is expected to increase demand for breeding ewes. These are expected to be joined to terminal sires with lamb production the focus rather than wool.
Price increases are impacting cropping operations in mixed farming regions which may prove positive for sheep production based on continued high sheepmeat prices. Some reports of tree plantations (for carbon offset schemes) displacing sheep in the southern slopes region. Reports of weaner shearing postponed from June/July, now scheduled to be shorn in September/October due to light condition of weaners. The New South Wales Committee’s second forecast of shorn wool production for 2025/26 was 100.4 Mkg greasy, down 8.7% on 2024/25.
Victoria
The poor seasonal conditions prevalent in April continued through to the end of June, particularly in the key wool producing regions of southwest Victoria (V21, V1, V07, V22 and V25, see Figure 5). The Bureau of Meteorology rainfall deciles were either very much below average or lowest on record for 2024/25 with average to below average root zone soil moisture percentiles. Full hand feeding continued from April to the end of June across most of Victoria with producers continuing to contend with the associated on-going labour and financial impacts. On-farm water supplies from Geelong across to the South Australian border continued to decrease to the end of June.
Many producers ceased 6-monthly shearing and reverted to an annual 12-month interval to cut costs in their wool operations. Increasing lamb and mutton prices, have prompted many producers to reduce further reduce numbers since April to generate some much-needed cash flow.
Pregnancy scanning rates were low at the start of the year but did tend to improve as the scanning season progressed. Lambing percentages were reported to be low due to the difficulty of feeding mobs of lambing ewes and mismothering. A wet weather event in April negatively impacted Autumn lambing flocks with lower marking rates. Turn-off of pregnant ewes occurred during the last quarter as producers had no feed, these were sold for processing un-shorn. Producers continue to explore options to shift into crossbred lamb production with increasing numbers of Merino ewes mated to a terminal sire.
Average cut per head retained at 4.35 kg greasy as the decrease in per head production was offset by low wool yield (64.2%) which was below the 20-year average. Wool test volumes in V21, the region from which most wool test volumes are produced was down by 26% compared with 2023/24. The Victorian Committee’s final estimate of shorn wool production for 2024/25 was 59.5 Mkg greasy, down 9.3% on 2023/24.
Widespread, although variable, rainfall occurred during July. This was not enough to replenish low soil moisture levels. Some green feed emerged, but it is short, lacking in dry matter and not able to support livestock production (‘i.e. green drought’). Full feeding continues in most regions. Pastures are rundown with weed incursions further decreasing quality. Stock water availability is a major concern. July’s rainfall had a negative impact on early spring-lambing flocks, with low lambing percentages reported. For others, the dry and warmer conditions will favour lamb survival, provided producers are able to continue to supplementary feed.
Further reduction in numbers is expected, without widespread follow-up rain. The next month will be critical, forecast rain must occur to slow sheep turn-off rates. Cash flow will be a major issue; producers will sell stock to capture high mutton and lamb prices. Bank finance decisions and drought relief announcements will impact producer decision making. The expected high cost of replacement ewes will slow any flock re-build. Fewer breeding ewes are expected to be joined in 2026, with fewer Merino rams joined unless wool prices improve. The Victorian Committee’s second forecast of shorn wool production for 2025/26 was 54.3 Mkg greasy, down 8.7% on 2024/25.
Western Australia
Below average Bureau of Meteorology rainfall deciles in key wool producing regions, average in northern and eastern regions for the season with low root zone soil moisture levels. Feeding continued in most regions to the end of the season. Wool cuts and lambing rates were below average in northern regions. Early lambing results in other regions were below average but improved in later lambing flocks. Good results in southern regions.
Continued move from Merinos to re-focus sheep enterprises on meat production. Merino ram sales continue to decline, replaced with terminal breeds. Reports of mulesing contractors working with crossbred ewe lambs indicating the intention to retain these lambs for breeding in the new season with the ewes to be sold once weaned.
Sheep slaughter from Western Australia has levelled out over the past three years and appears to have absorbed stock previously destined for live export as the total turnoff of adultsheep is relatively unchanged. However, it is likely a greater proportion of females have been slaughtered. Interstate transfers totalled 334,000 for 2024/25 with 75% of those lambs. The Western Australian Committee’s final estimate of shorn wool production for 2024/25 was 44.9 Mkg greasy, down 18.4% on 2023/24.
Average to above average rainfall deciles for July, have set up a good spring for most of the state. Central regions and eastern wheatbelt remain tight, lambs were sold to feedlots to finish. Southern regions were comfortable. Stock water supplies remain low in many regions, follow up rain will replenish levels. The late start to the season was welcome, but cold weather reduced early pasture growth.
Early Merino marking rates appear reasonable. Reports of processors buying more lambs earlier as adult sheep are in relatively low supply. Producers are willing to sell their lambs earlier if they are ready to go. Some development of forward contracts for lamb, a potential indicator of processor concern regarding future supply.
Recent shearings indicate improved staple strength but lighter cut per head. The Committee were concerned regarding the impact of recent rainfall in Eastern states on demand for breeding ewes further reducing numbers in Western Australia. July interstate sheep movements were low. Some producers are endeavouring to retain Merino breeding ewes, expecting low availability and high prices if they need to purchase. Concerns regarding sufficient Merino breeding ewes in coming seasons, given the increase in Merino to Terminal ram joinings. Producer sentiment remains negative particularly regarding wool production, although a good Spring may change sentiment. Increasing cost of fertiliser is emerging as another key concern with lower usage rates expected which will negatively impact pasture production. The Western Australian Committee’s second forecast of shorn wool production for 2025/26 was 40.1 Mkg greasy, down 10.7% on 2024/25.
South Australia
The drought/dry conditions continued across most of South Australia to the end of June 2025. While rainfall deciles through parts of the pastoral regions (northwest and north east) were above average and average through central regions, all southern regions (where most of the SA clip is grown, Figure 7) were below average to lowest on record. Root zone soil moisture was very much below average for the latter.
The 2024/25 season was one of the toughest for sheep production in South Australia. Most sheep producers continued full feeding in the face of increased scarcity of feed and higher cost of feed. Sheep turn-off continued with high mutton prices providing much needed cash flow as producers turned off 4-year-old ewes. Some regions report sheep numbers down by 30 to 50%. Sheep slaughter was up 45% to the end of March 2025 (86% above the 5-year average). Wether lambs have also been sold.
Lambing percentages are reported to be much lower than average with mismothering due to lambing in containment or while full feeding a major contributing factor. Few flocks have reached their usual lambing or marking averages, most are at least 20% lower.
Little to no wool was held prior to sale. Wool reported as tested and in broker stores ready for sale. High shearing costs are impacting on decisions regarding breed with continued move from Merino to shedding sheep. Sheep continue to be sold unshorn, lowering the shorn:opening ratio.
Average cut per head at historical low, with AWTA Key Test Data indicating the impact of the poor season on per head production. Mean fibre diameter was down 0.3 μm to 20.3 μm, staple length was down 1.8 mm to 88.3mm and staple strength was down 1.9N/ktex to 33.4 N/ktex. Vegetable matter remained high at 2.9% with yield down 2.2% to 59.8%. The South Australian Committee’s final estimate of shorn wool production for 2024/25 was 47.3 Mkg greasy, down 18.4% on 2023/24.
Widespread rainfall across much of the state occurred during July (average to very much above average rainfall deciles). However, cold weather limited growth of feed and full feeding continued in many regions. A ‘green drought’ is prevalent in most regions although the rain has generated some positivity regarding sheep production. Livestock feed continues to be scarce, recent hay runs from Western Australia were welcome. Hay crops are being sown at the expense of sheep to rebuild depleted fodder stores.
Follow up rain will be required in the new few months to ward off further reductions in sheep numbers. Loss of lambs during 2024/25 will hinder any flock rebuild as fewer young ewes will be available for joining in 2025/26. The Committee expects any flock recovery to be slow with a time frame of at least 4 to 5 years. Cut per head is expected to be lower due to the poor season impacting growth and quality (i.e. poor yield) of new season clips. Further reduction of older age groups of ewes is expected following weaning.
Recent Merino ram sales in western regions were tough, many clients had completely destocked and fewer rams were offered for sale. Some reports of opportunistic growth in sheep flocks or trading of scanned-in-lamb ewes. The South Australian Committee’s second forecast of shorn wool production for 2025/26 was 39.8 Mkg greasy, down 15.9% on 2024/25.
Tasmania
Dry conditions persisted from April through to the end of June. The Bureau of Meteorology rainfall declines were either average or below average for 2024/25 with similar results for root zone soil moisture. Overall sheep numbers remained stable, although producers continued to move from Merino wool to crossbred lamb production. Wool production is expected to be at a similar level to the 2023/24 season. Yields have been reasonable at 70.0% which is marginally below the 20-yr season average (70.2%), despite the dry conditions. No significant change in producer sentiment since the April meeting. The Tasmanian Committee’s final estimate of shorn wool production for 2024/25 is 9.2 Mkg greasy, down 1.1% on 2023/24.
The season remains dry. But overall is better than last season. More rainfall is needed to set up for a good spring. Mutton kills remains high, but sheep sales are expected to slow as lambing approaches. The peak shearing period is over for Tasmania. Wool quality has been maintained, yield is holding steady with an increase in staple length. Recent shearings indicate wool cuts are slightly heavier, however overall wool volumes are expected to decline due to lower Merino numbers.
Sheep producers continue to consolidate meat production. Reports of movement to shedding breeds in northern regions. No big changes back to Merino production are expected. Spring ram sales in October/November will provide a good indication of producer sentiment towards wool production. An increase in wool prices will improve producer sentiment regarding wool production and encourage a movement back to Merino production. The Tasmanian Committee’s second forecast of shorn wool production for 2025/26 was 8.7 Mkg greasy, down 5.4% on 2024/25.
Queensland
The season ended well following a tough summer, with the Bureau of Meteorology recording above to very much above average rainfall deciles in key wool producing regions producing average to above average root zone soil moisture levels.
Flooding associated with the major rainfall event (600 – 700 mm) in mid-March and subsequent losses from exposure (lighter weight sheep with 10 months fleece) caused estimated sheep losses of approximately 100,000 head. While these losses occurred in a relatively narrow geographic area the impact on affected producers was severe when stock losses (30 - 40%) together with infrastructure damage (roads and fencing) were considered. On-going losses due to considerable wild dog activity in a wider area occurred due to wide-spread damage to exclusion fencing. Very low autumn lambing percentages were the result.
High shearing costs, reduced wool prices and high sheepmeat prices continue to impact on producer decision making, with dry ewes sold (reports of ewe numbers down by 30% sold post-shearing) and numbers of shedding sheep continuing to increase. The increase in crossbred auction volumes was due to sale of held over clips from the previous 4-5 years due to the increased crossbred wool prices in the latter part of the season.
The tough summer reduced per head production, Mean fibre diameter was down 0.4 μm to 19.0 μm (a 20-yr low) with a 2.2N/ktex reduction in staple strength. The Queensland Committee’s final estimate of shorn wool production for 2024/25 was 9.2 Mkg greasy, down 8.9% on 2023/24.
Sheep numbers are down, high mutton prices are expected to continue to drive flock reduction with sheep increasingly viewed as ‘food not fibre’ and providing an opportunity for producers to exit the sheep industry. Further sell off is expected post-shearing in August as producers capitalise on the recent higher wool prices Reduced wether numbers, mean breeding ewes now comprise up to 86% of the state’s flock. Low lambing percentages in 2024/25 will reduce the availability of replacement breeding ewes.
Reasonable wool cuts (close to the long-term state average) are expected in regions not impacted by the flood event, due to good seasonal conditions and feed growth between April and July, however tender wool is expected due to the marked change in seasonal conditions. Further increases will be tempered by the flock comprising a greater proportion of younger breeding ewes due to older age groups being sold. The Queensland Committee’s second forecast of shorn wool production for 2025/26 was 8.2 Mkg greasy, down 10.9% on 2024/25.
Appendix
Table A1: Comparison of shorn wool production in 2024/25 against the 2023/24 season and the second forecast for 2025/26 against the 2024/25 season
At their September 2022 meeting, the AWPFC National Committee resolved to include a clean estimate of shorn wool production based on the yield (%, Schlumberger dry top and noil yield) from the AWTA key test data for each complete season.
Historical Australian Production Figures
The tables below provide historical sheep shorn numbers, wool production, fleece weight and micron share statistics since 1991/92 for background information.
Table A2: Australian wool production statistics since 1991/92
At their September 2022 meeting, the AWPFC National Committee resolved to include a clean estimate of shorn wool production for each full season based on the yield (%, Schlumberger dry top and noil yield) from the AWTA key test data for that season.
Explanation of revised AWPFC data series
At the December 2005 meeting, the National Committee made the decision to collate and review the key variables (shorn wool production, cut per head, number of sheep shorn) used in the committee from the available industry sources and to create a consistent historical data series at both a state and national level. This was required as some differences existed between industry accepted figures and the AWPFC data series and to ensure a consistent methodology over time. This process resulted in changes to the parameters ‘average cut per head’ and the ‘number of sheep shorn’ for some seasons at both a state and national level.
Modus operandi for the Australian Wool Production Forecasting Committee
The Australian Wool Production Forecasting Committee draws together a range of objective data and qualitative information to produce consensus-based, authoritative forecasts four times a year for Australian wool production.
The Committee has a two-level structure, with a National Committee considering information and advice from state committees. It is funded by Australian Wool Innovation Limited, which also provides a representative in the role of the Chairman of the National Committee.
The National and state committees comprise wool producers, wool brokers, exporters, processors, private treaty merchants, AWEX, AWTA, ABARES, ABS, MLA, state departments of Agriculture, sheep pregnancy scanners and AWI.
The Committee releases its forecasts in the forms of a press release and a report providing the detailed forecasts, historical data and commentary on the key drivers of the forecasts.