




Market intelligence report
Here we look at the market's strong start in 2026 and the potential drivers impacting production and demand over the coming months.
Steady start to the 2026–27 season
The 2026–27 Australian wool selling season has opened with supply at historically low levels, providing an important foundation for prices despite considerable early-season volatility. National offerings are running below last season and the latest production outlook points to continued tight availability, with the August Wool Production Forecast for 2026–27 of 249.3 million kilograms greasy, down 1.8% year-on-year.
This tight supply was a key feature of the strong Week 9 (27 Aug) rebound. After falling to 1,812 A¢/kg in Week 8, the Eastern Market Indicator recovered 41 cents to 1,853 A¢/kg as buyers competed for just 23,651 bales, the smallest three-centre offering since 2020. The market strengthened across most Merino categories, while the national pass-in rate fell to only 2.0%, highlighting the intensity of competition for available wool.
Improved seasonal conditions have lifted production expectations from earlier forecasts, although any production recovery will take time given the reduced national flock. Hence supply is likely to stay top of mind for buyers as Chinese domestic demand remains strong and early-stage processor inventories decrease.
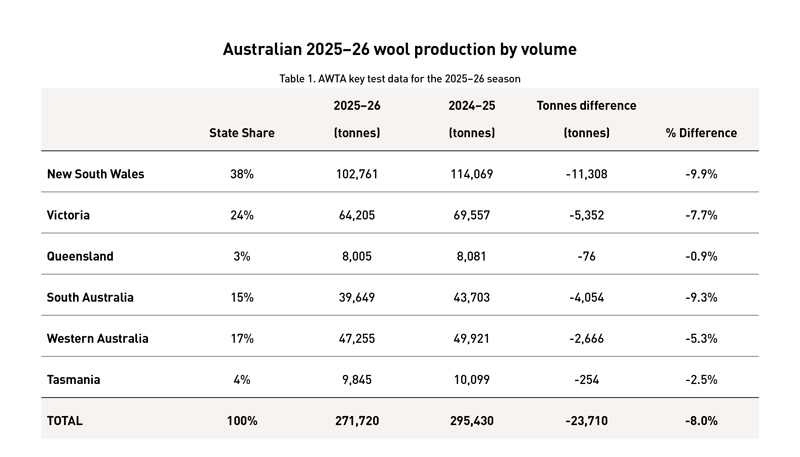
Australian wool production, as measured by AWTA key test data, declined by 8.0% year-on-year to 271.7 million kilograms for the 2025–26 season, representing a national reduction of 23.7 million kilograms. All states recorded lower testing volumes, confirming that the contraction in wool supply was broad-based rather than concentrated in a single region.
New South Wales accounted for the largest absolute decline, with volumes falling by 11.3 million kilograms, or 9.9%, and remained the largest producing state with a 38% share of national supply. Victoria and South Australia also recorded substantial reductions of 7.7% and 9.3% respectively. Together, these three states contributed almost 88% of the total national decline, highlighting the extent to which weaker production across the eastern and southern wool-growing regions shaped the national result.
Western Australia recorded a smaller decline of 5.3%, while Queensland and Tasmania were comparatively stable, down 0.9% and 2.5% respectively. Although these states provided some moderation, their smaller production shares were insufficient to offset the larger reductions elsewhere.
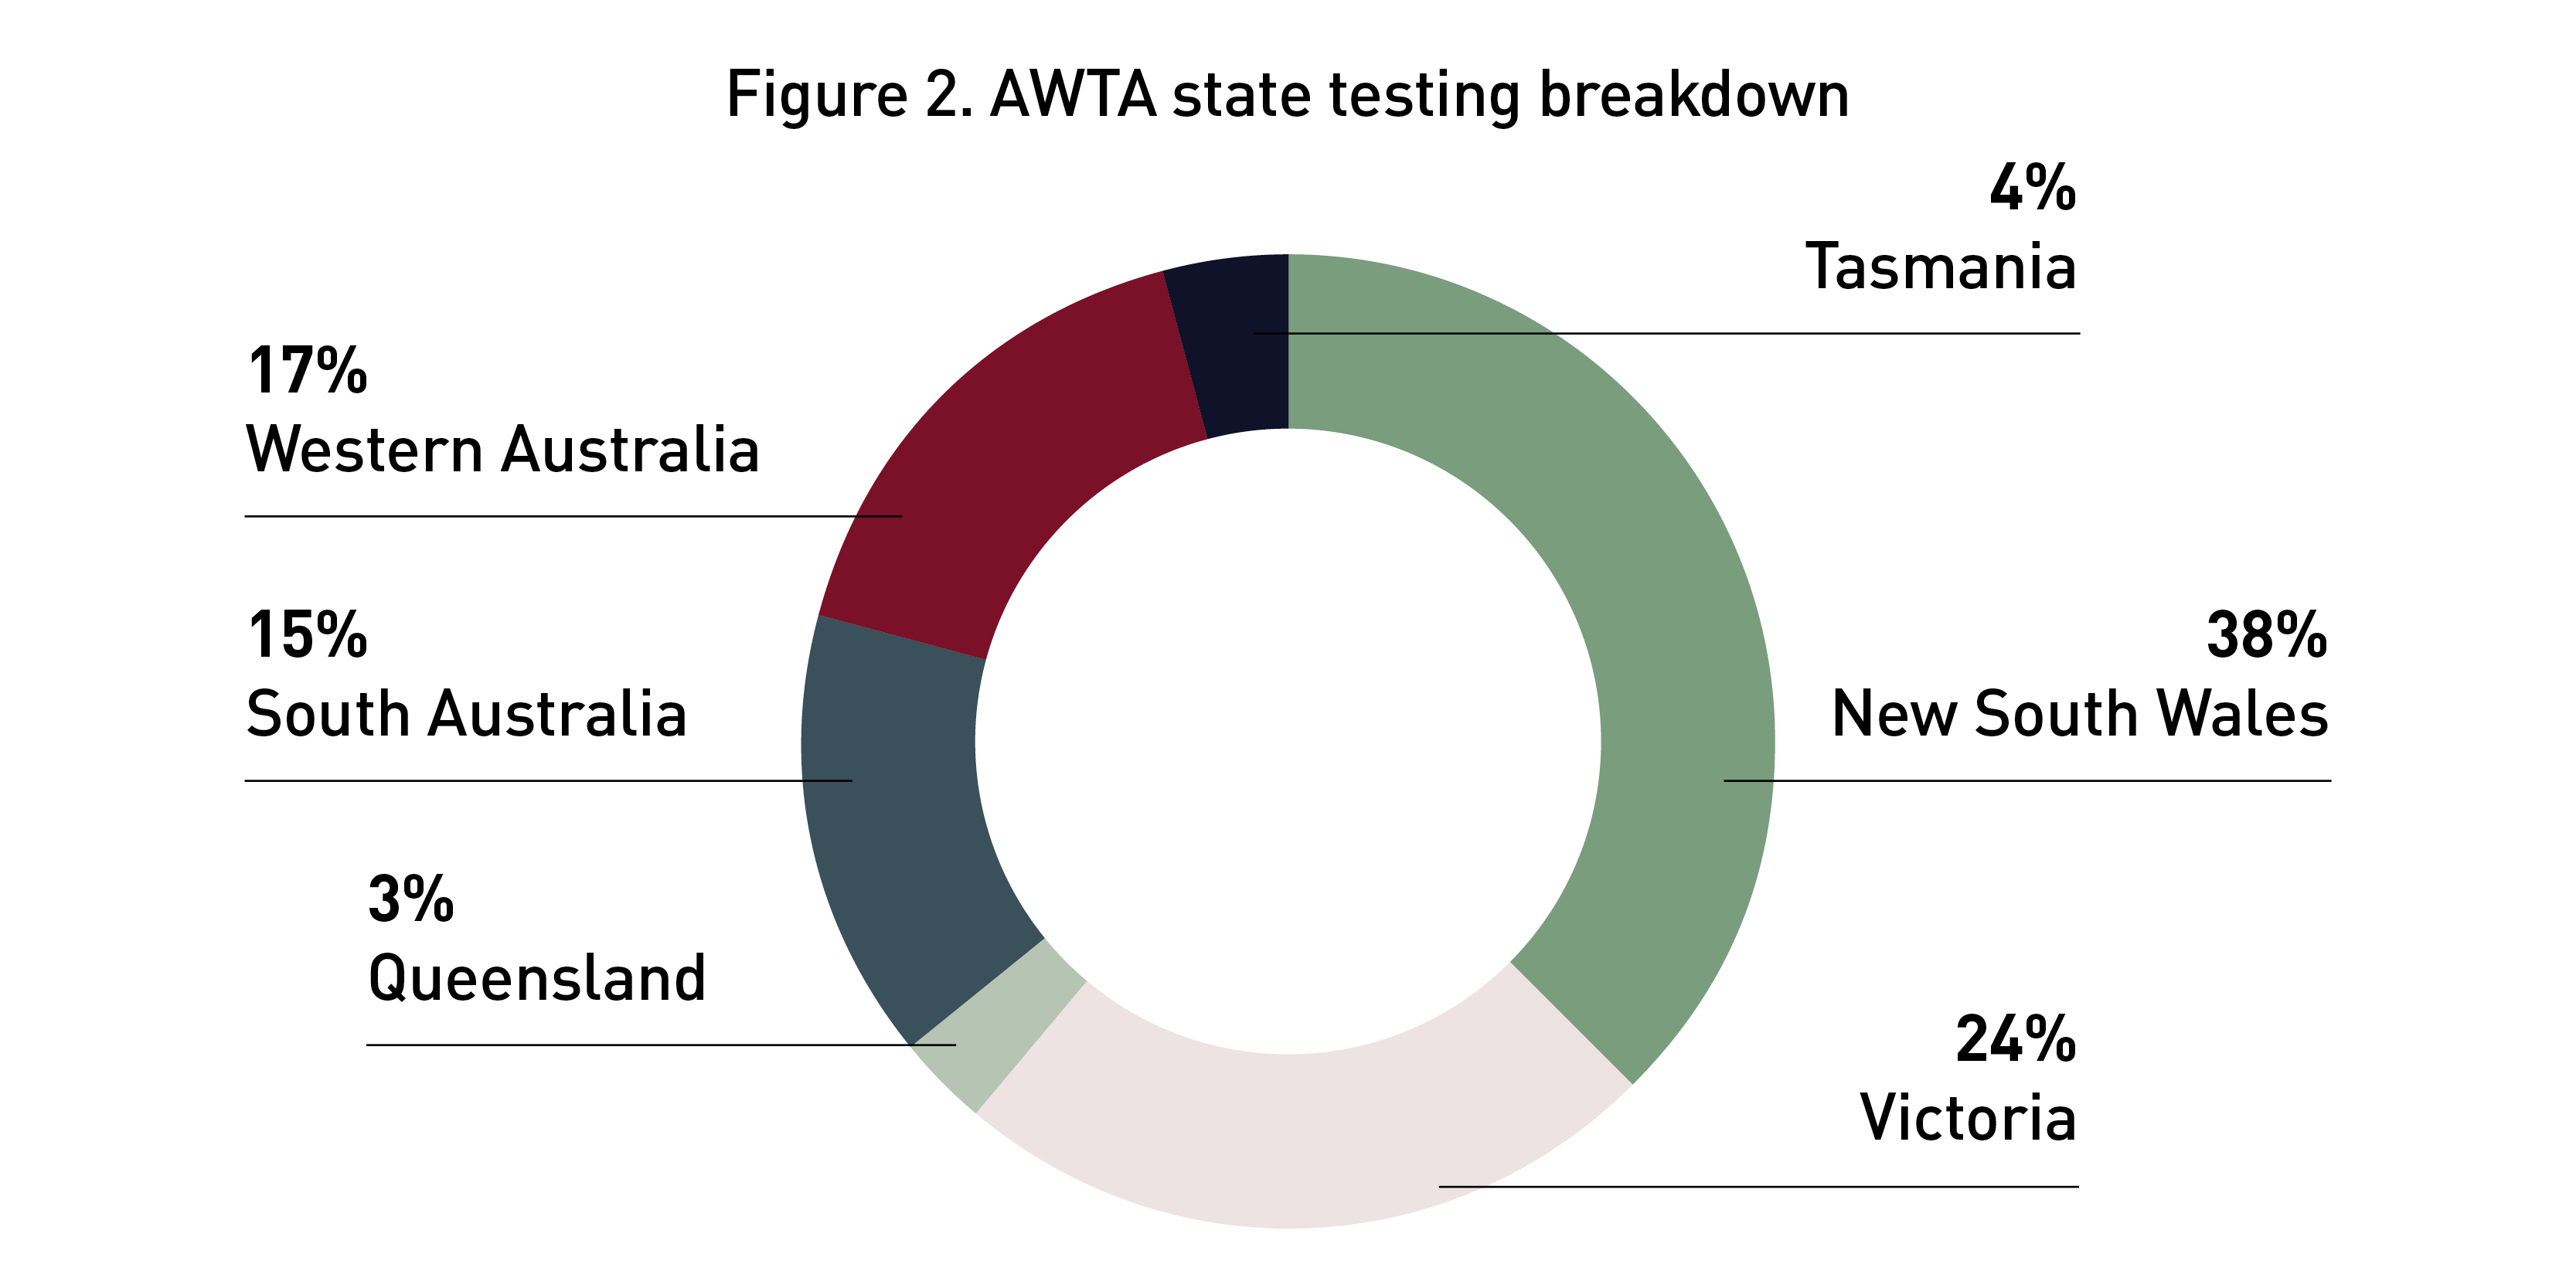
AWTA test data for the 2025–26 season shows that New South Wales accounted for the largest share of wool tested, at 38% of the national total. Victoria contributed a further 24%, followed by Western Australia at 17% and South Australia at 15%. Tasmania and Queensland represented smaller shares, at 4% and 3% respectively. Together, New South Wales and Victoria accounted for almost two-thirds of the wool tested during the season.
Wool Auction Offering Update – AWEX Auction Data – 25–26 Season
- Offered 1,496,803 bales compared to the 1,541,414 bales offered last season. That is 44,611 bales less, or 2.9% less wool offered.
- Sold 1,402,559 bales compared to the 1,419,576 bales sold last season. That is 17,017. bales less, or 1.2% less wool sold.
- Clearance rates this season are running at 93.7% compared to 92% cleared over the same period last season.
- Total value sold through the auction system is A$2,614 million, compared to A$1,940 million last season at the same time. This is an increase of A$675 million in value of wool sold.
The data points to a market where lower wool supply has been more than offset by stronger prices and improved buyer demand. While auction offerings are down 2.9%, sales have fallen by only 1.2%, indicating that a greater proportion of the available wool is being absorbed by the market. This is reflected in the clearance rate rising from around 92% to 93.7%.
The number of bales not sold has fallen from approximately 121,800 last season to 94,200 this season – a reduction of about 22.6%. This suggests growers have been more willing to meet the market, buyers have been more active, or a combination of both.
The most significant result is the rise in total auction value.
Despite 17,017 fewer bales being sold, the value of sales has increased by about A$674–675 million, or almost 35%. The implied average value per bale has risen from approximately A$1,367 last season to A$1,864 this season, an increase of around 36%.
The 2025/26 auction market was characterised by reduced supply, stronger clearance rates and substantially higher returns per bale. This indicates that price strength, rather than increased volume, is driving the large rise in the value of wool sold through the auction system.
Production by Micron – AWTA Testing Data – 25–26 season end
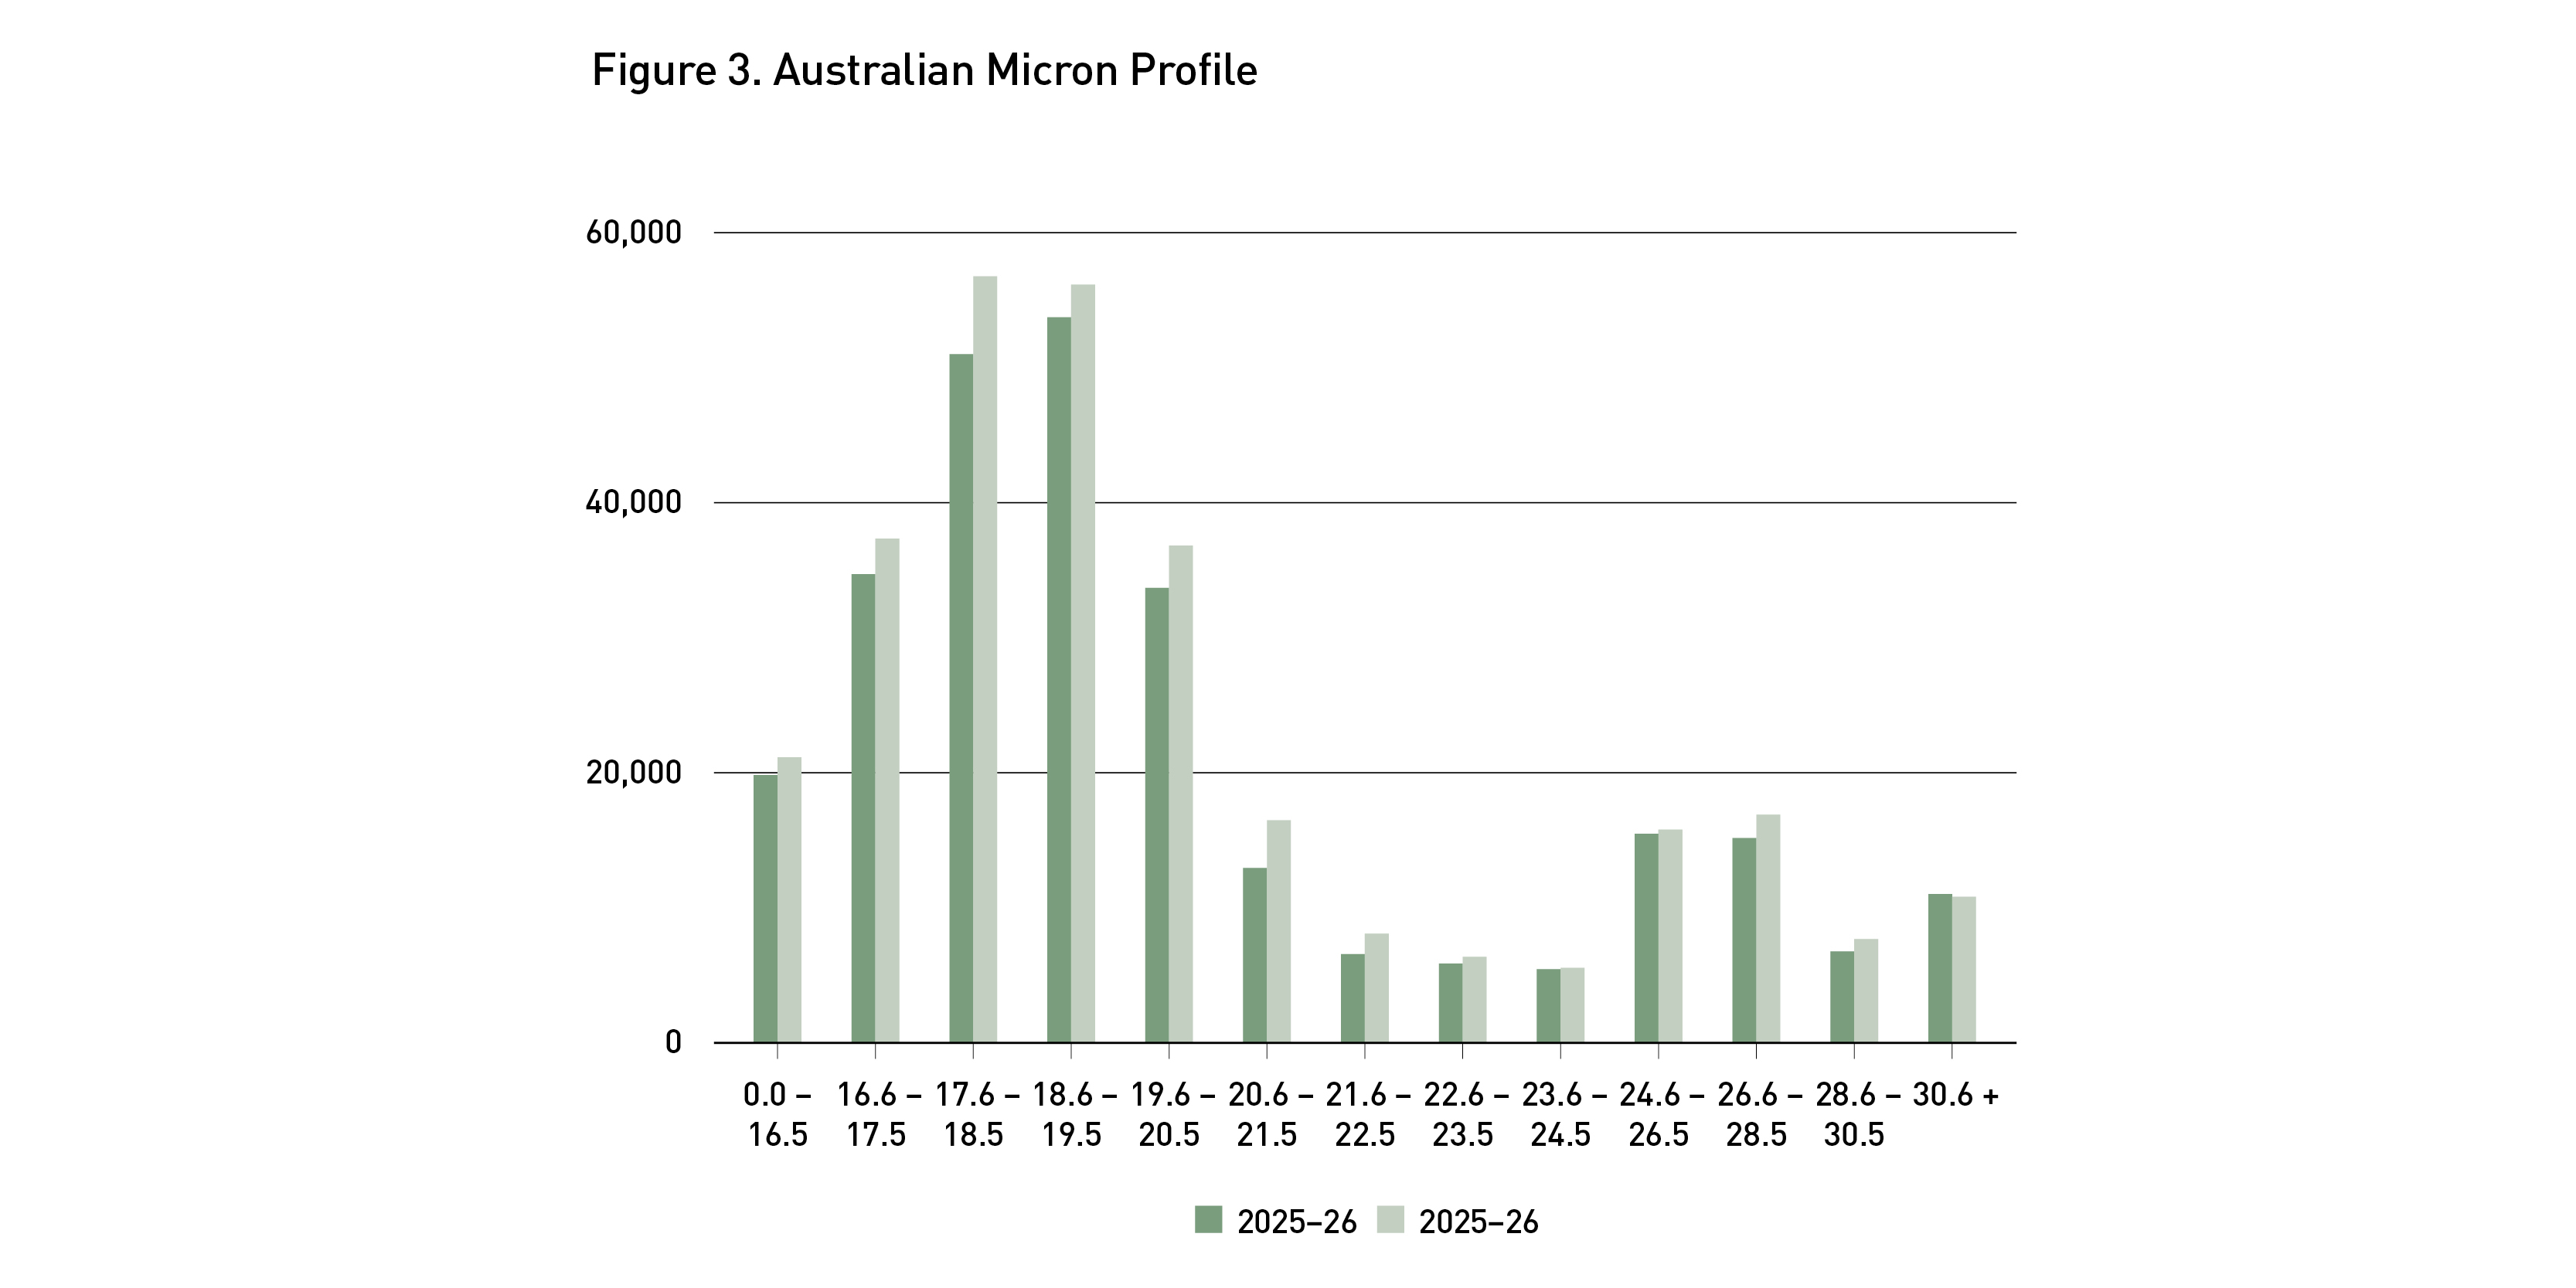
The AWTA testing data indicates that wool production was lower across most micron categories in 2025–26 compared with the previous season. The largest volumes remained concentrated between
17.6 and 20.5 microns, confirming that fine and medium Merino wool continued to dominate the Australian clip. However, each of these major categories recorded a year-on-year decline, with the reduction particularly noticeable in the 17.6–18.5 micron range.
The sharpest proportional falls appear in the 20.6–22.5 micron categories, suggesting a more pronounced contraction in production of broader Merino and fine crossbred wool. Volumes below 17.5 microns also declined, although the reduction was less severe.
Production was comparatively stable between 23.6 and 26.5 microns, while the 30.6-micron-and-broader category was one of the few segments to record an increase. The data suggests the decline in the Australian wool clip was broadly distributed, rather than being confined to one micron category, but was most evident across the central Merino ranges that account for the largest share of national production.
Wool Pricing Update – 25–26 season
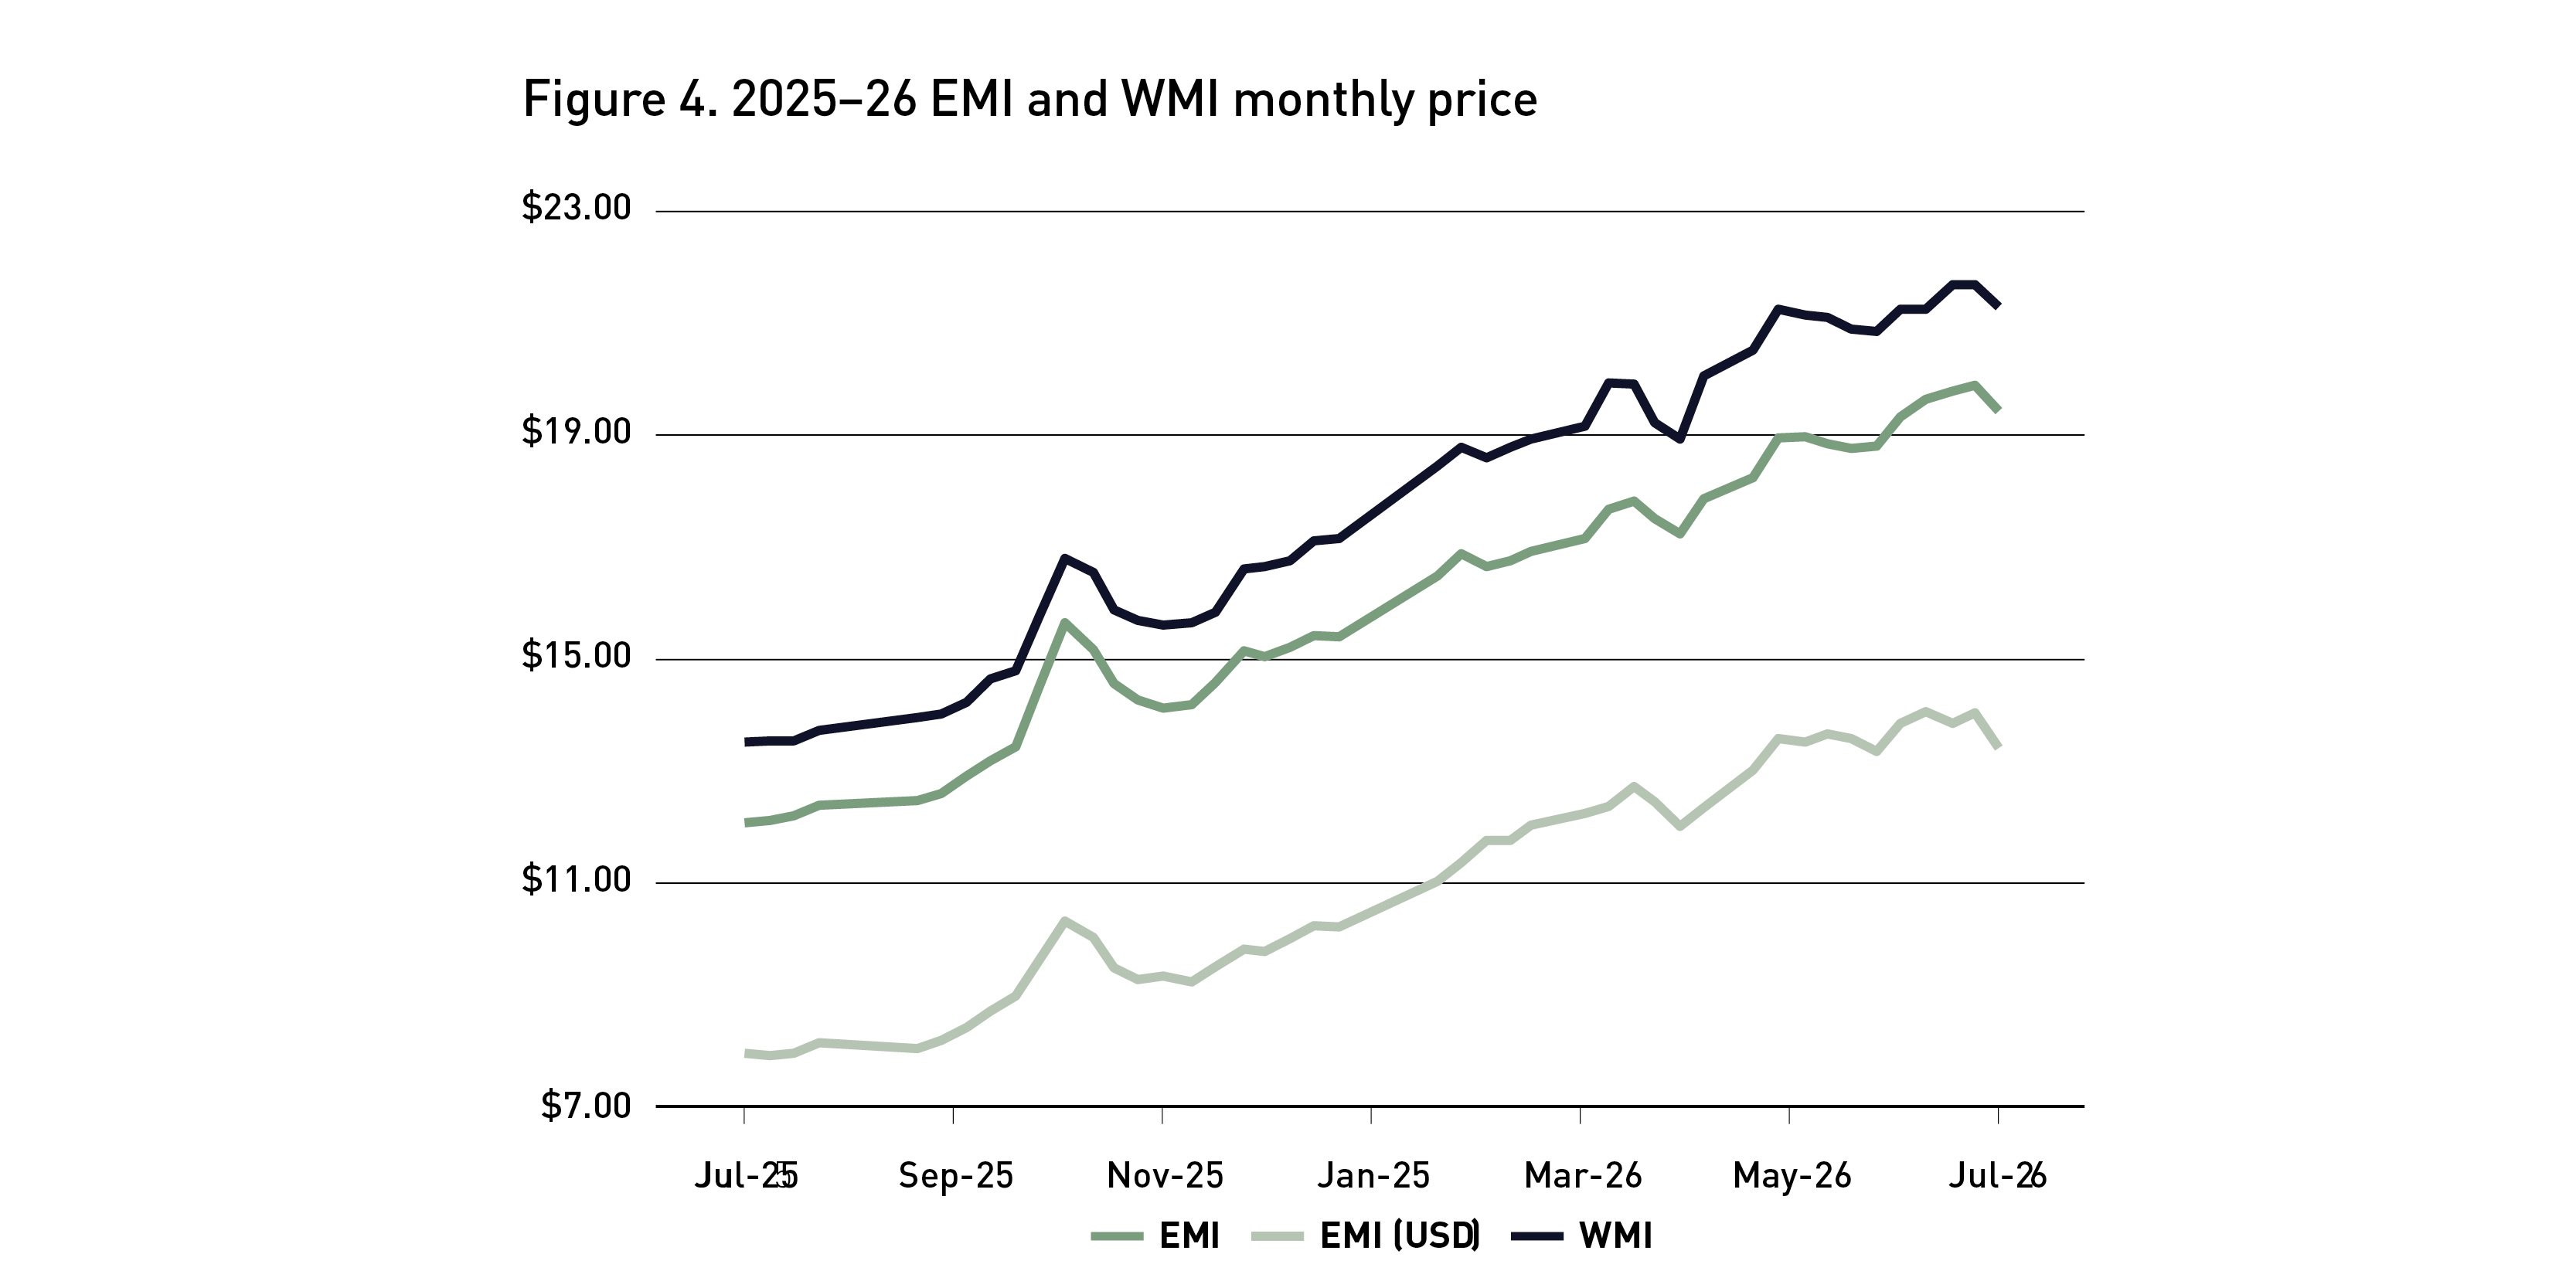
The pricing data shows a strong upward trend across the 2025–26 season, with all three indicators finishing well above their opening levels. The EMI rose from around $12.00 per kilogram clean at the start of the season to about $19.50 by season end, an increase of roughly 60%. The WMI followed a similar path, climbing from approximately $13.50 to above $21.00, while the EMI in US dollar terms increased from about US$8.00 to around US$13.50.
Price growth was not continuous. The market rose sharply in October, eased through November, and then resumed its upward movement from December. Further volatility occurred during March and April, but the broader trend remained positive, with prices reaching their highest levels in May and June.
The WMI remained above the EMI throughout the period, indicating stronger relative pricing in the Western Australian market. The gap between the Australian-dollar EMI and the US-dollar EMI also widened during parts of the season, showing that exchange-rate movements influenced the returns seen by overseas buyers and Australian sellers.
The chart points to a significantly stronger wool market in 2025–26. Prices increased despite lower auction volumes, supporting the view that reduced supply, firm demand and improved clearance rates contributed to stronger competition for available wool. The small decline at the end of the season suggests some late easing, but prices remained substantially higher than at the beginning of the period.
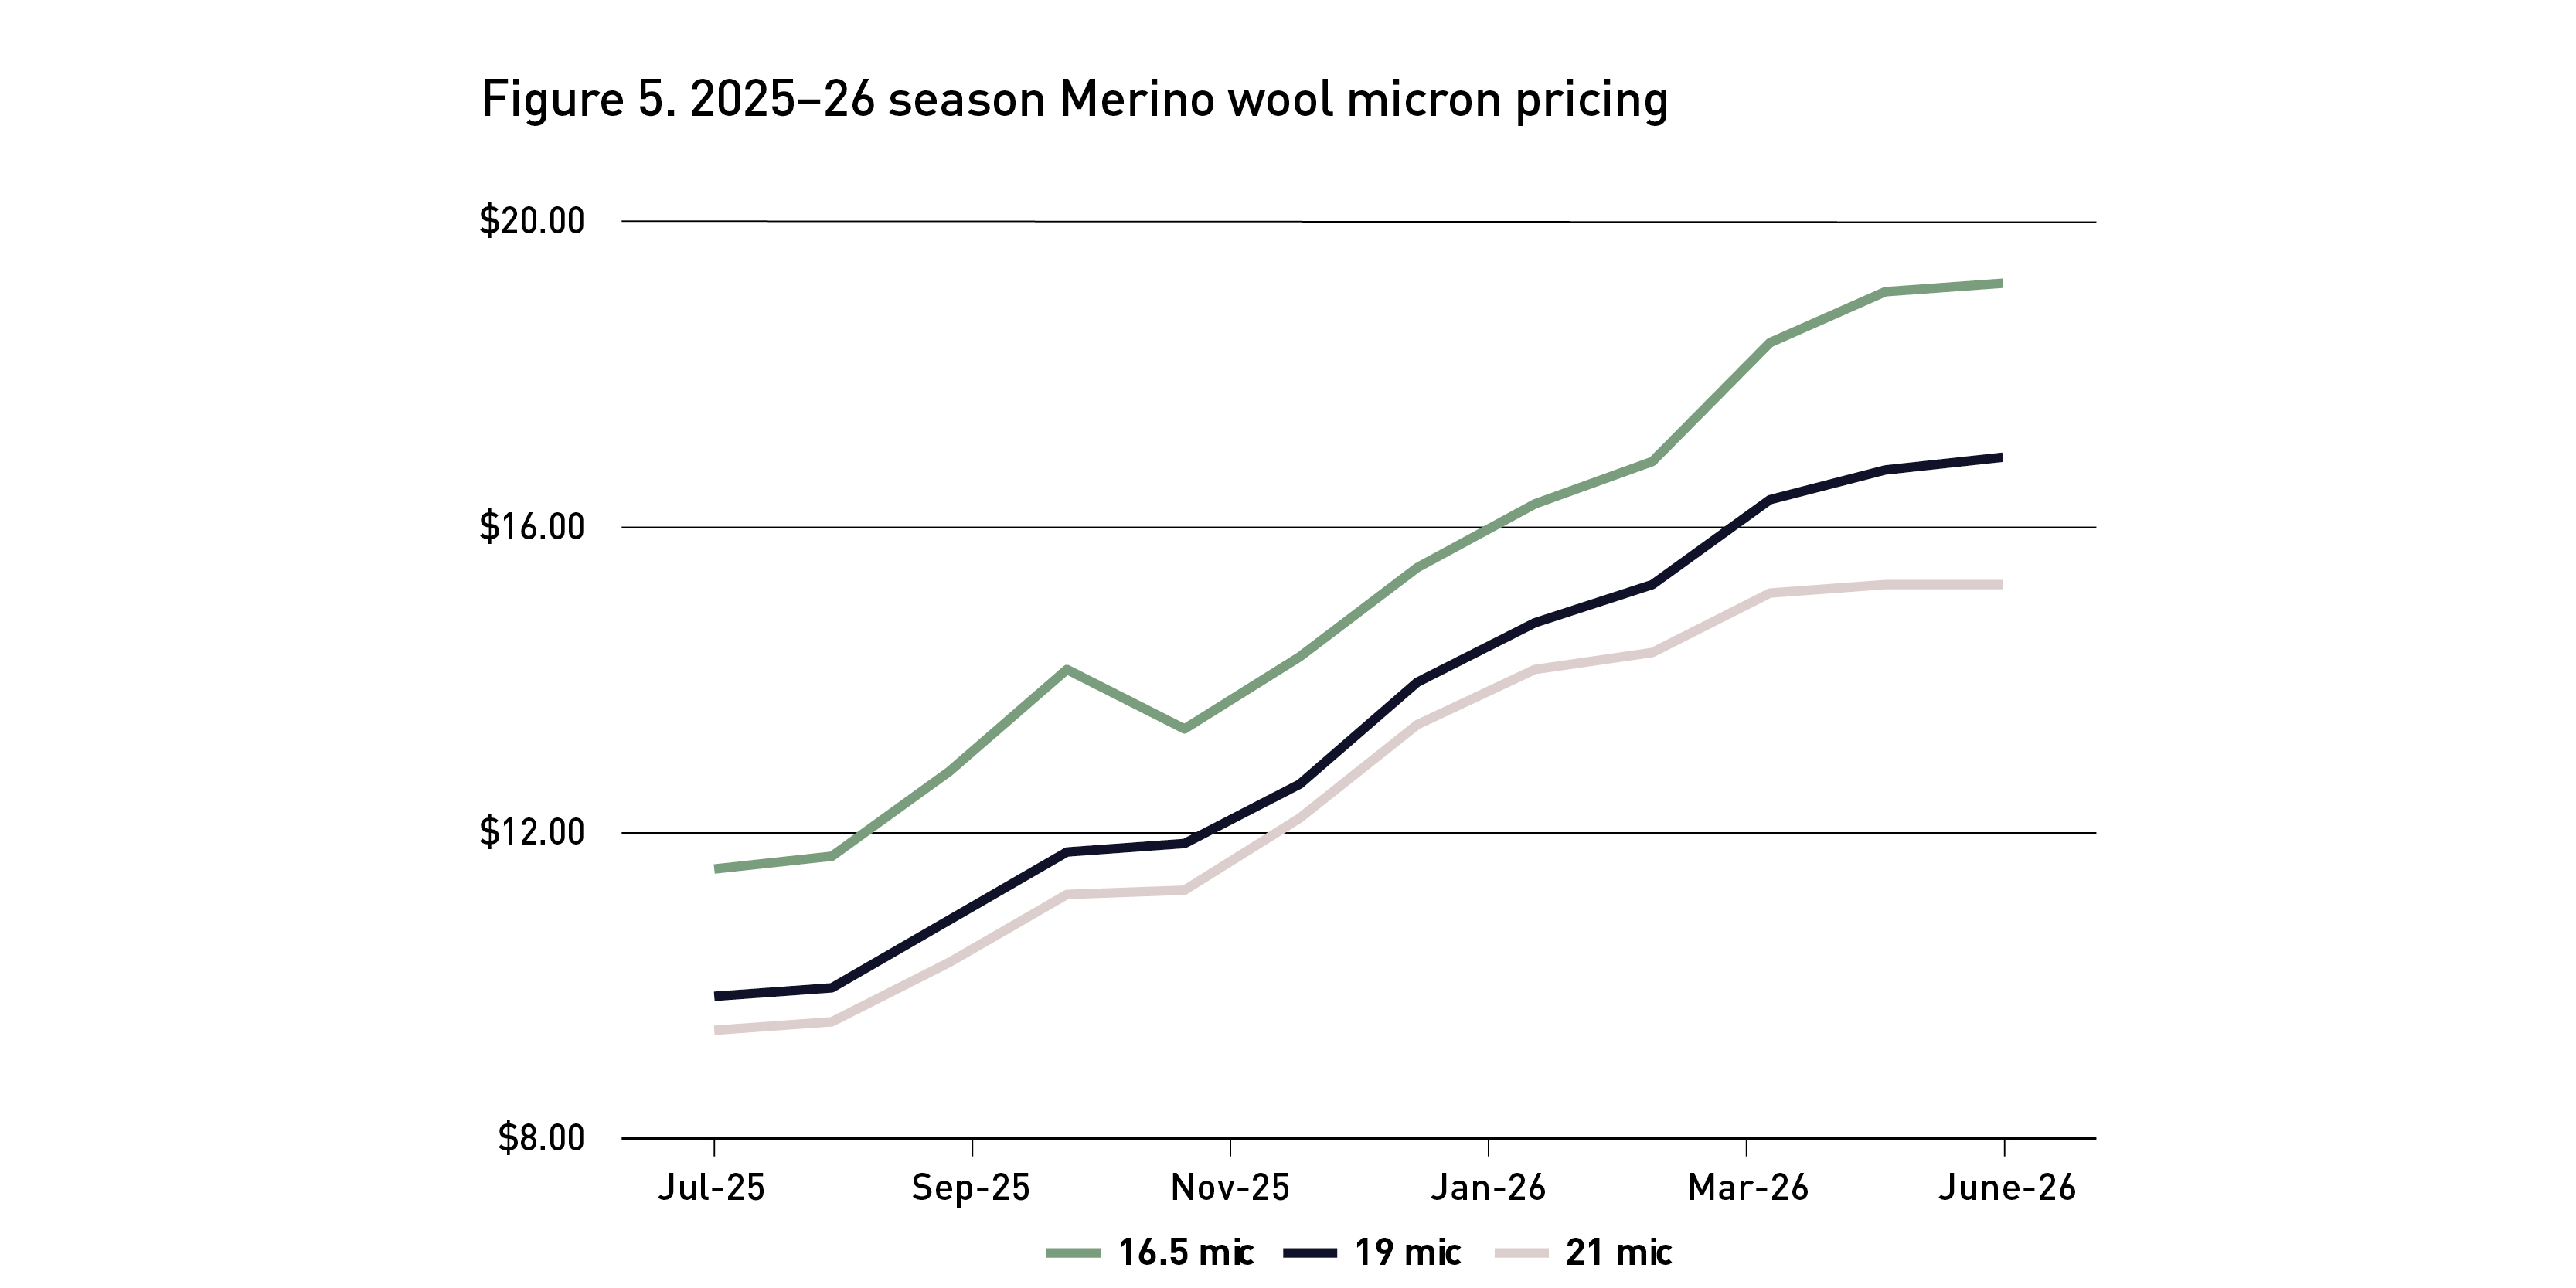
Micron prices strengthened markedly through the 2025–26 season, with the finest wool recording the largest gains. The 16.5-micron indicator rose from about $11.00 per kilogram clean in July to just above $19.00 by June, an increase of roughly 74%. Prices for 19-micron wool increased from around $9.50 to $16.80, while 21-micron wool rose from about $9.00 to $15.20.
The three micron categories followed a similar pattern. Prices climbed steadily through winter and early spring, rose sharply in October, then eased in November before resuming their upward trend. The strongest gains occurred from January to April, after which price growth slowed and the indicators began to level out.
The premium for finer wool widened as the season progressed.
The gap between 16.5-micron and 21-micron wool increased from about $2.00 per kilogram clean at the start of the season to nearly $4.00 by June. This indicates particularly strong demand for superfine wool relative to broader micron categories.
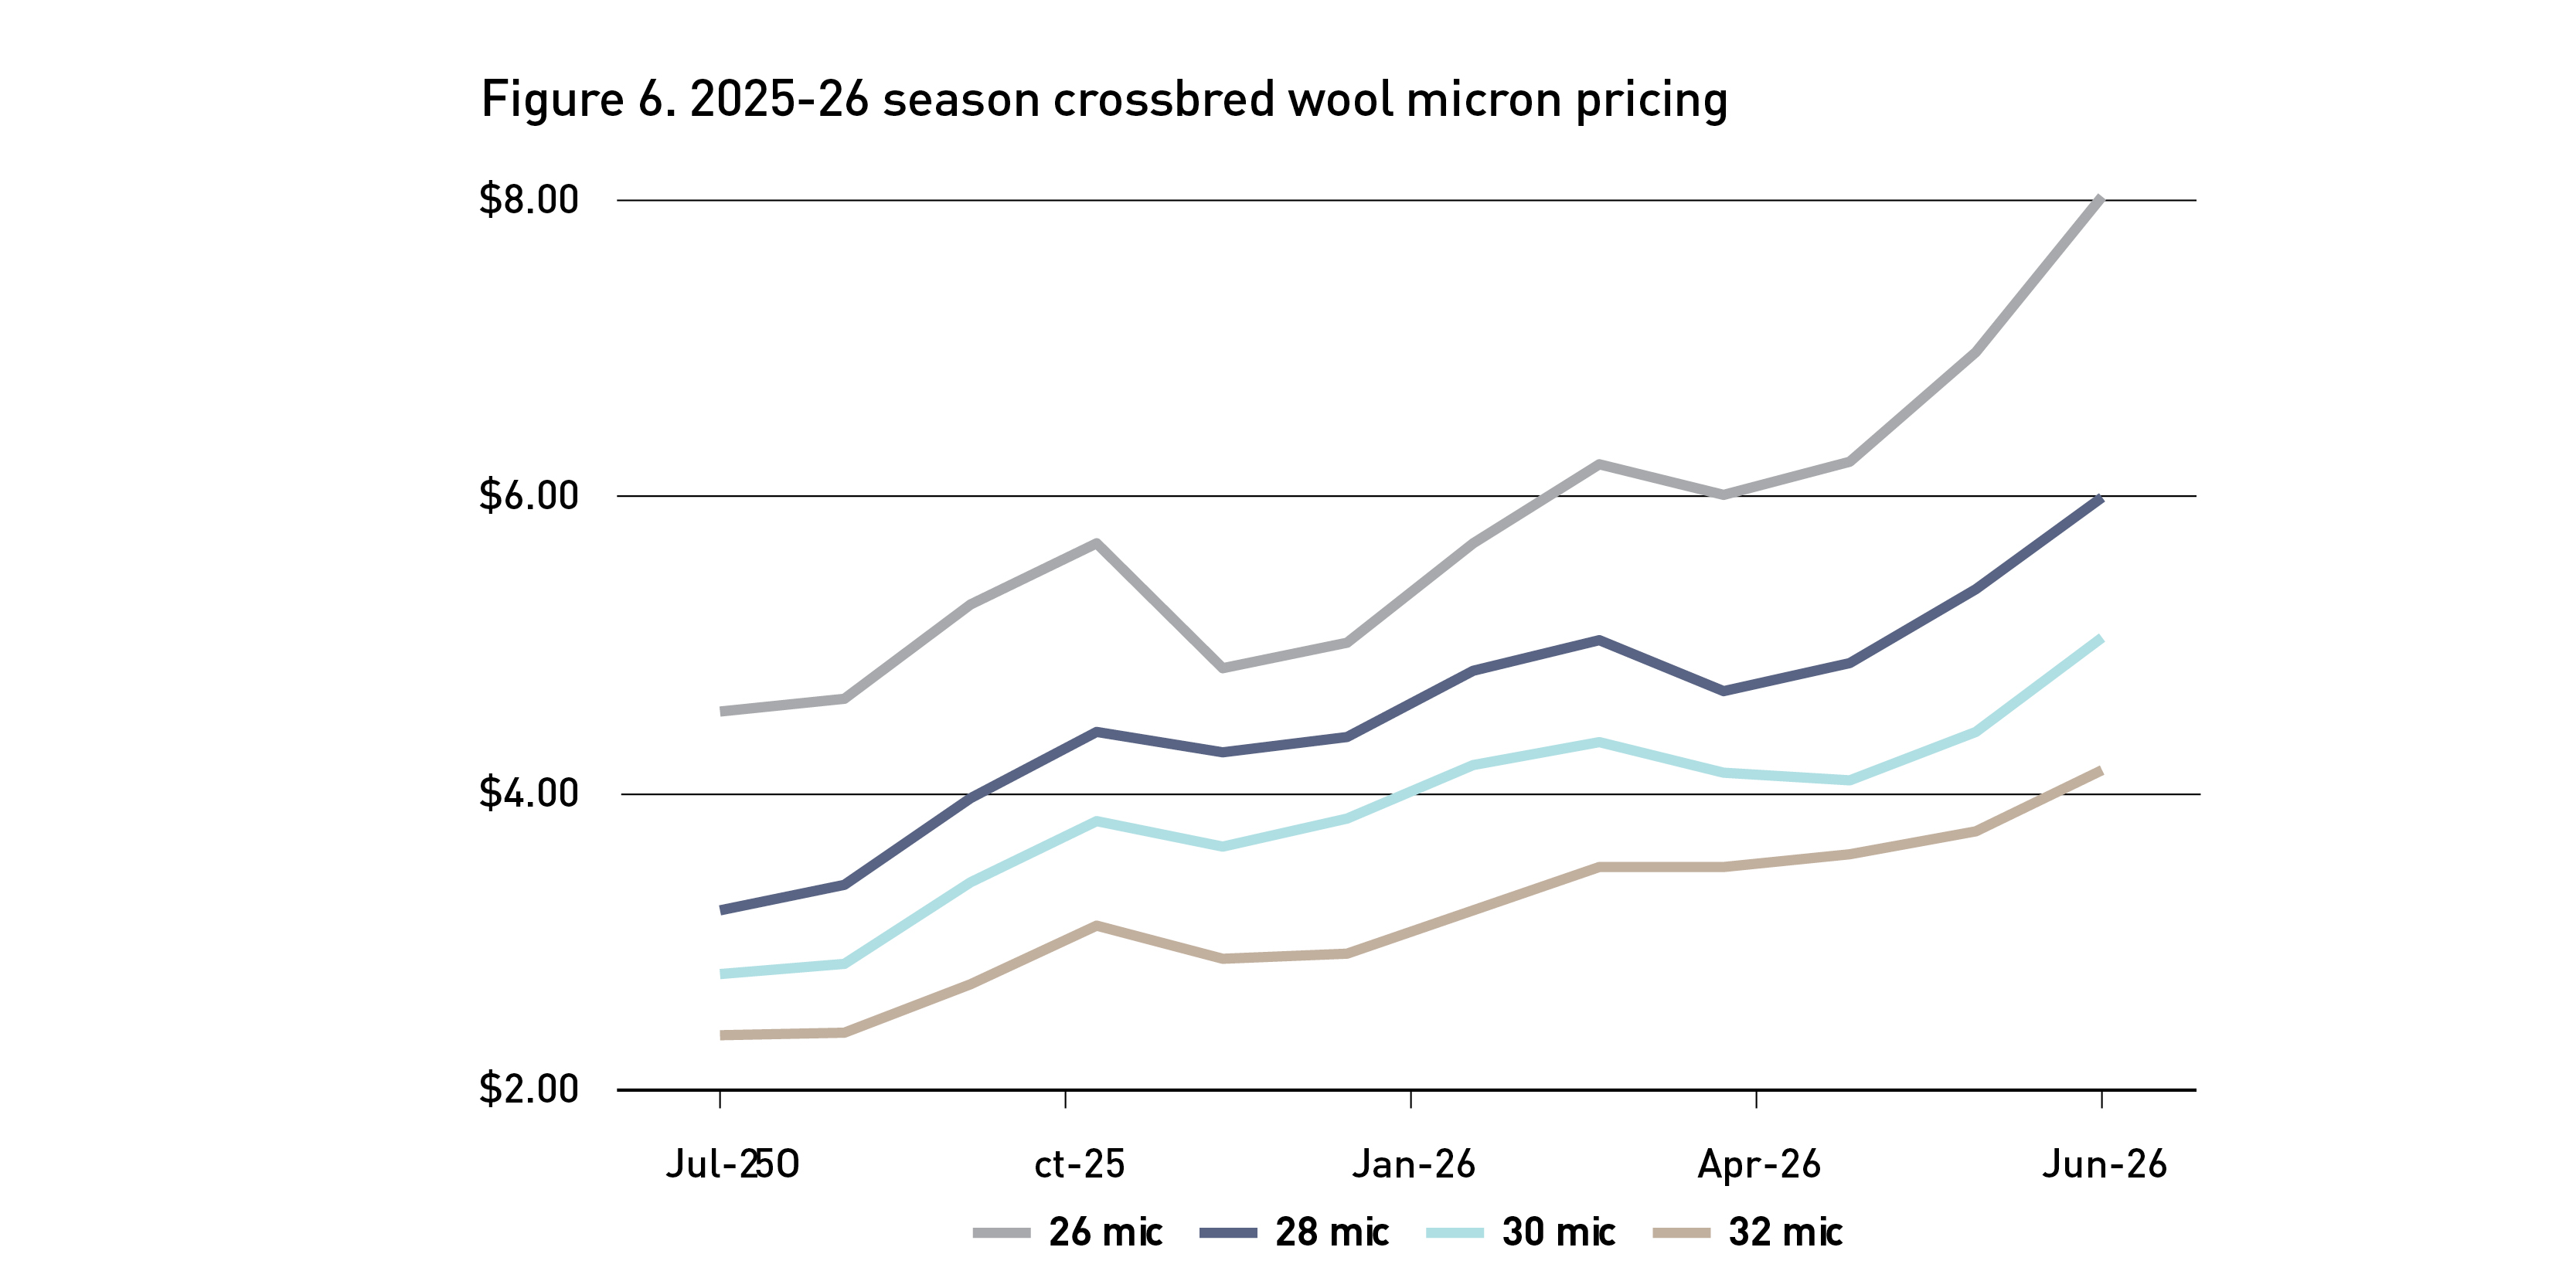
Crossbred wool prices strengthened across all four micron categories during the 2025–26 season, with the largest gains occurring toward the end of the period. The 26-micron indicator rose from about $4.50 per kilogram clean in July to $8.00 by June, an increase of roughly 78%. The 28-micron indicator increased from around $3.20 to $6.00, while 30-micron wool rose from approximately $2.70 to $5.00. The 32-micron indicator also improved, climbing from about $2.30 to just above $4.00.
The price spread between the finer and broader crossbred categories widened over the season. The difference between 26-micron and 32-micron wool increased from a little over $2.00 per kilogram clean in July to almost $4.00 by June, indicating stronger relative demand for the finer end of the crossbred range.
The sharper rise in 26-micron wool suggests that demand was strongest for the finer end of the crossbred range. These wools can compete with broader Merino types in some applications, while 30–32 micron wool is more concentrated in heavier apparel, interiors and other coarser-wool uses. That helps explain why all crossbred categories increased, but 26 micron rose the most.
Australian Wool Exports – ABS Data 2025/26 season
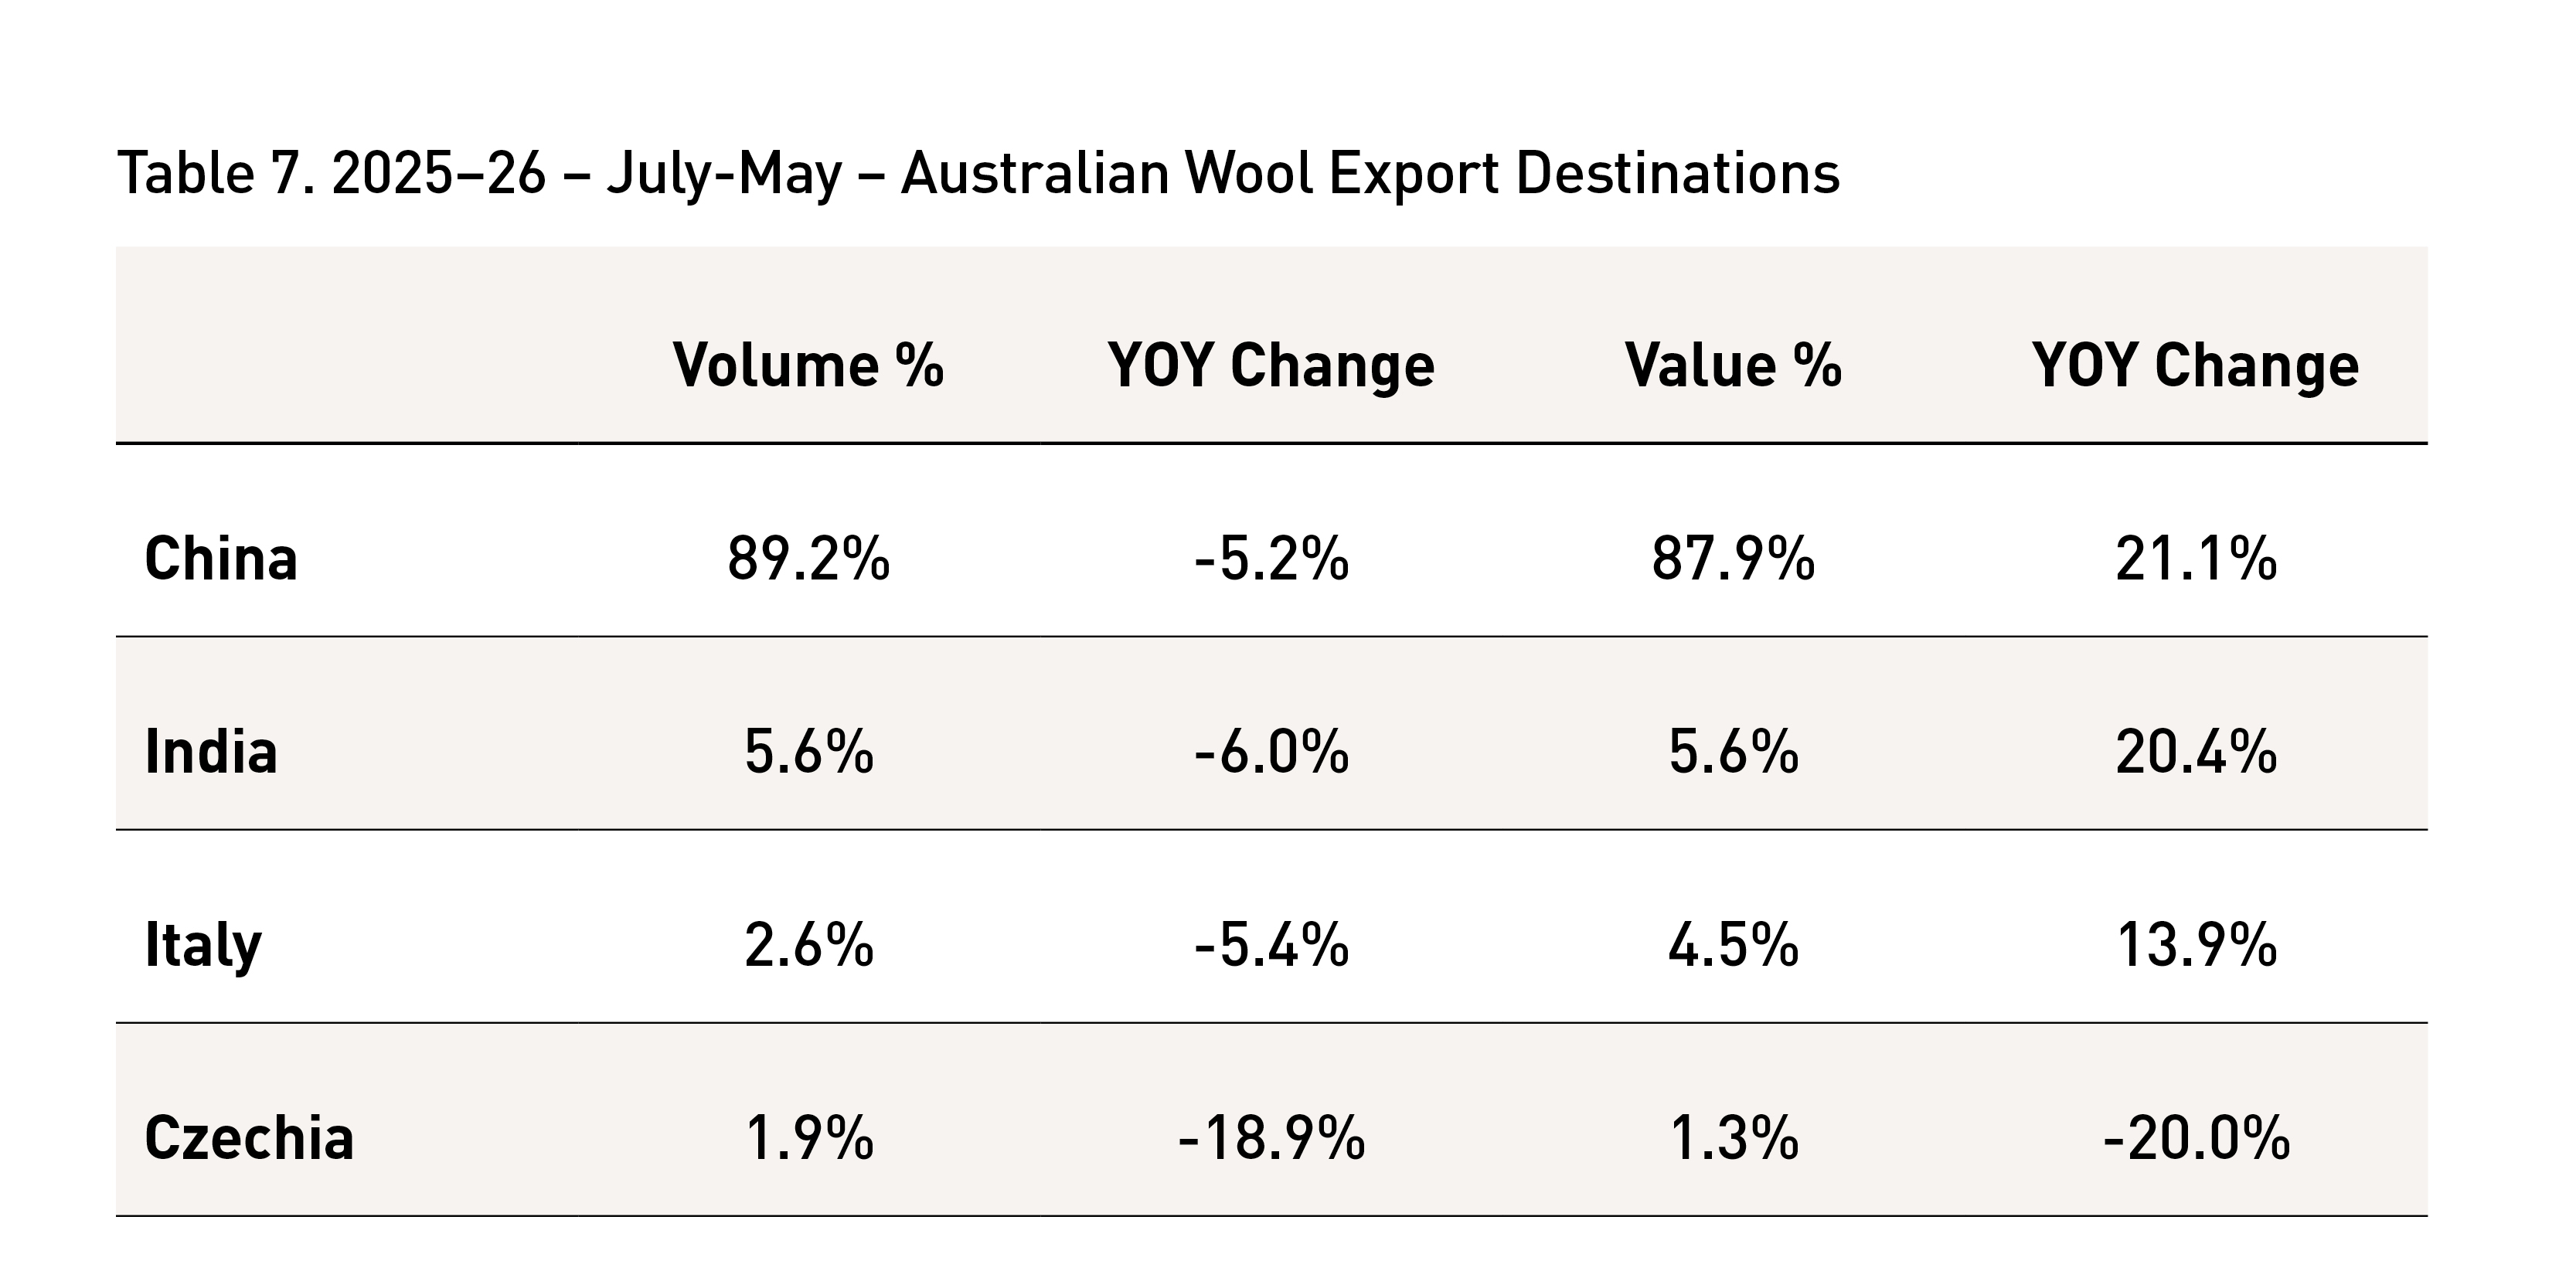
China remained overwhelmingly Australia’s largest wool export market, accounting for 89.2% of export volume and 87.9% of export value. Although shipments to China fell by 5.2%, their value increased by 21.1%, implying a substantial rise in the average value of wool exported. This is consistent with the stronger wool prices recorded during the 2025–26 season.
A similar pattern occurred in India and Italy. Export volumes declined by 6.0% and 5.4% respectively, while export values increased by 20.4% to India and 13.9% to Italy. Based on these movements, the implied average export value increased by approximately 28% for India, 28% for China and 20% for Italy. This indicates that higher prices more than compensated for reduced shipment volumes across the three major markets.
Italy accounted for only 2.6% of export volume but 4.5% of export value, reflecting its tendency to purchase higher-value fine and superfine wool. India’s volume and value shares were both 5.6%, suggesting its purchases were broadly in line with the average value of Australian wool exports. China’s value share was slightly below its volume share, reflecting the broader range of wool types purchased by Chinese processors.
Czechia was the exception, with export volume falling by 18.9% and value declining by 20.0%. This indicates both weaker demand and a broadly unchanged to slightly lower average value per unit. The figures also highlight the continued concentration of Australian wool exports in China, leaving export earnings highly exposed to changes in Chinese processing demand and market conditions.
This article appeared in Issue 106 of AWI’s Beyond the Bale magazine that was published in September 2026. Reproduction of the article is encouraged and should be attributed as follows: This article was first published in Issue 106 of AWI’s Beyond the Bale magazine.