Australian Wool Production Forecast Report May 2025
The Australian Wool Production Forecasting Committee (AWPFC) has updated its forecast of shorn wool production for the 2024/25 season. The fourth forecast is for production of 280.1 million kilograms (Mkg) greasy. This is 11.8% lower than the 2023/24 season estimate.
Summary
- The Australian Wool Production Forecasting Committee’s (AWPFC) fourth forecast of
Australian shorn wool production for 2024/25 is 280 million kilograms (Mkg) greasy, 11.8%
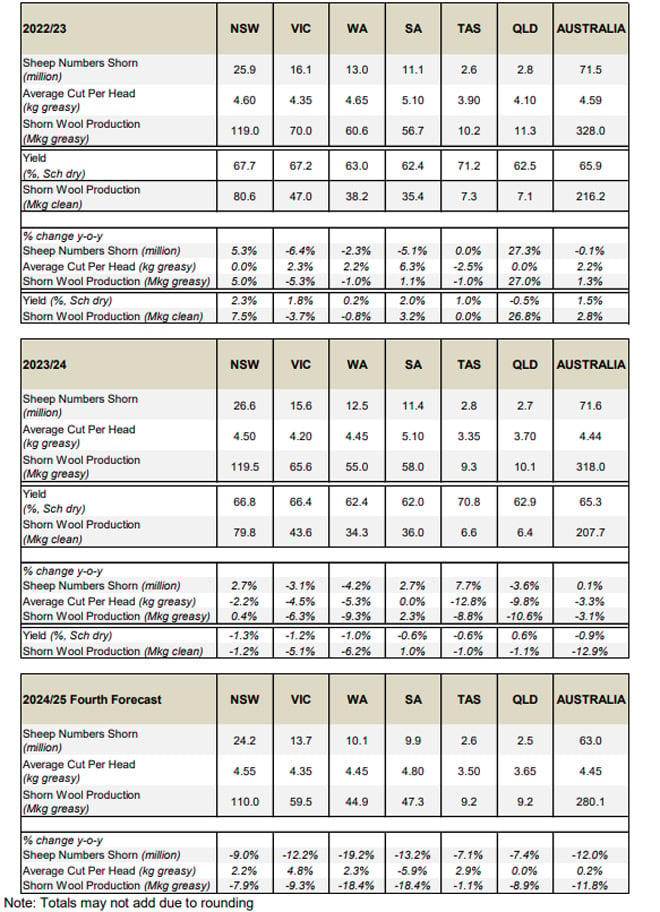
lower than the 2023/24 season estimate. - New South Wales is forecast to have the largest sheep flock, shearing 24.2 million head
(down 9.0% compared with 2023/24) and produce 110.0 Mkg greasy wool (down 7.9%
compared with 2023/24). Victoria is expected to shear 13.7 million sheep (down 12.2%)
and produce 59.5 Mkg greasy (down 9.3%) with Western Australia forecast to produce
44.9 Mkg greasy (down 18.4%) from 10.1 million sheep shorn (down 19.2%). South
Australia is forecast to shear 9.9 million head (down 13.2%) and produce 47.3 Mkg greasy
(down 18.4%). The number of sheep shorn in Queensland (2.5 million head, down 7.4%)
and Tasmania (2.6 million head, down 7.1%) are both expected to produce 9.2 Mkg greasy
(down 8.9% and 1.1%) respectively. - Average cut per head is forecast to be comparable with 2023/24, at 4.45 kg greasy (up
0.2%). AWTA key test data for the 2024/25 season to the end of March show small yearon-year changes in mean fibre diameter (down 0.3 microns), staple length (up 0.3mm),
staple strength (down 1.5 N/ktex) and yield (down 1.1%). VM was unchanged at 2.2%. - AWTA wool test volumes for the 2024/25 season July to March were down by 8.9% on a
year-on-year basis. The volume of wool tested decreased in all states. - First-hand offered wool at auction during 2024/25 to week 40 were down by 9.1% with
decreases in all states. - Sheep slaughter from July to December 2024 was up 29% compared with the same time
in 2023 and was 58% above the five-year July to September average. Lamb slaughter was
down 6% compared with July to December 2023 but remained 12% above the five-year
average. - The Bureau of Meteorology is forecasting average to above average median rainfall for
Western Australia and western to central regions of South Australia, but below median
rainfall in other key wool producing regions with above average median maximum
temperatures likely to very likely for most of Australia. - The revised 2024/25 forecast reflects the continuing drought conditions in western
Victoria and South Australia and a decrease in the number of sheep shorn in all states.
Commodity prices, input costs and variable seasonal conditions continue to impact on
sheep producer’s decisions regarding their enterprise mix, particularly in Western
Australia. - The APWFCs first forecast of shorn wool production for the 2025/26 season is 257 Mkg
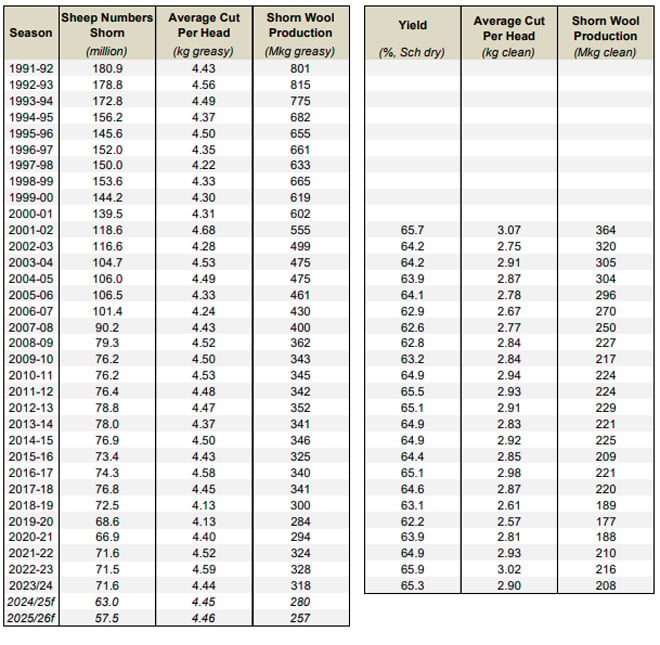
greasy, an 8.4% decrease on the 2024/25 forecast. - Table 1 summarises Australian wool production and Table 2 shows the total shorn wool
production by state. Table 3 provides a comparison of AWTA key test data for the 2024/25
and 2023/24 seasons from July to March.
- More detailed information on the shorn wool production by state in 2024/25 can be found
in Table A1 in the Appendix to this report. - The Appendix also provides historical data for Australia, including sheep shorn numbers,
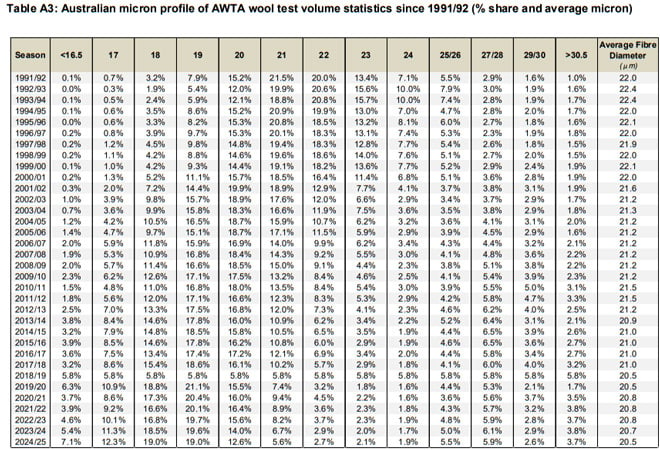
average cut per head and shorn wool production (Table A2) as well as the micron profile
(Table A3) since 1991/92.
Detail on shorn wool production for the 2024/25 forecast
Major data inputs
The AWPFC forecasts are based on detailed consideration by the state and national committees of data from various sources including:
- AWTA wool test data for the 2024/25 season from July 2024 to March 2025;
- AWEX first-hand auction statistics for the 2024/25 season from July 2024 to March 2025 (Week 40);
- ABS sheep and lamb turn-off for the 2024/25 season to December 2024;
- Information on current and expected seasonal conditions from the Bureau of Meteorology.
AWTA wool test data
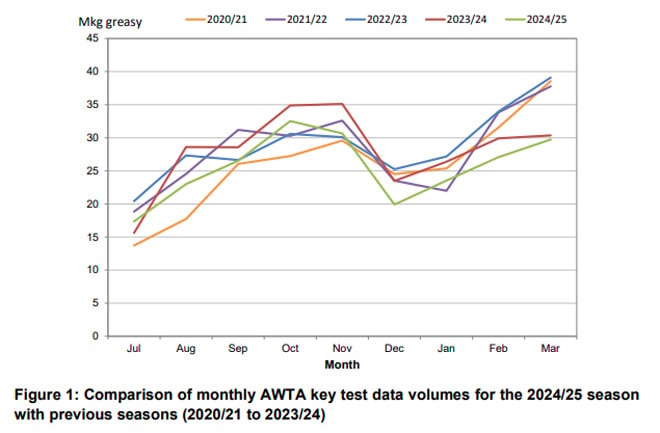
Every month AWTA releases data on the volumes of greasy wool tested within the various diameter categories for the month and the season to date. Data for the 2024/25 season from July to March are compared with the corresponding nine months in previous seasons (2020/21 to 2023/24).
The month-by-month comparison of wool tested during the 2024/25 season show test volumes below the five-year average in July, August, September and November. Test volumes for October 2024 were second only to those in October 2023 (Figure 1). Apart from January 2025, test volumes from December 2024 to March 2025 were the lowest for the past four seasons.
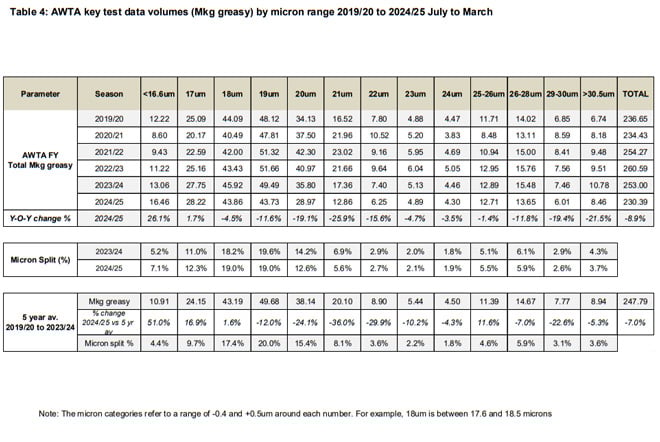
AWTA national wool test volumes data for the 2024/25 July to March (Table 4) shows:
- Volumes of wool tested were 8.9% lower than July to March during 2023/24 at 230.39 Mkg greasy. This was 7.0% lower than the July to March five-year average from 2019/20 to 2023/24.
- There were increases in the weight of wool tested in the less than 16.6 microns (up 26.1%) and 17 microns (up 1.7%) categories. The weight of wool tested in all other micron categories decreased by between 1.4% (25 – 26 microns) and 25.9% (21 microns).
- The largest micron categories by volume were the 18-micron (43.9 Mkg greasy), 19-micron (43.7 Mkg greasy) and 20-micron (29.0 Mkg greasy) categories.
- The micron split (% of total weight of wool tested) during July to March in 2024/25 showed small increases in the finer (i.e. less than 18 microns) end of the micron range. The difference across the micron categories with July to March 2023/24 ranged from -1.6% (20 microns) to +2.0% (less than 16.6 microns)
The micron profile of the Australian wool clip continues to have two distinct peaks. One centred
around 18- to 19-micron wool (finer than 16.6 microns up to 23 microns) and a second centred
around 26 - 28 microns (from 24 microns to 30.5 microns and broader) (Figure 2).
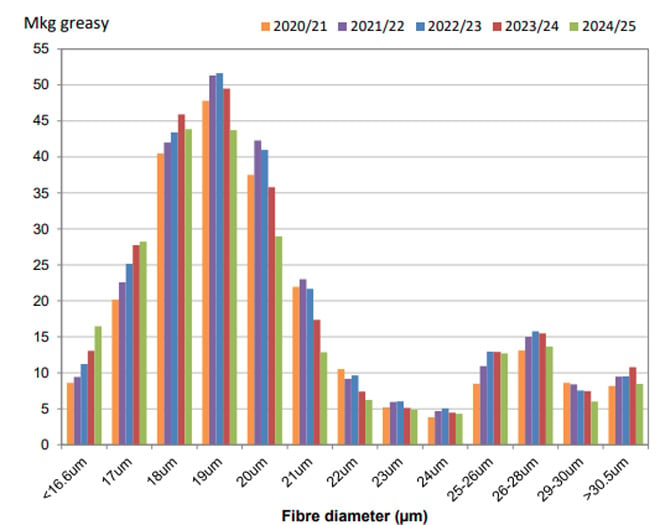
Figure 2: Australian fibre diameter profile – 2024/25 season July to March compared with the 2020/21 to 2023/24 seasons
A historical comparison of the Australian wool clip’s micron profile percentage share and average micron can be found in Appendix Table A3 (at the end of this report).
Based on data by Wool Statistical Area (WSA), the volumes of wool tested from July to March during 2024/25 decreased in all states (Figure 3). Western Australia had the greatest decrease in the volume of wool tested (down 17.8%), followed by South Australia (down 14.0%), Tasmania (down 9.1%), Victoria (down 5.2%), New South Wales (down 4.7%) and Queensland (down 4.4%).
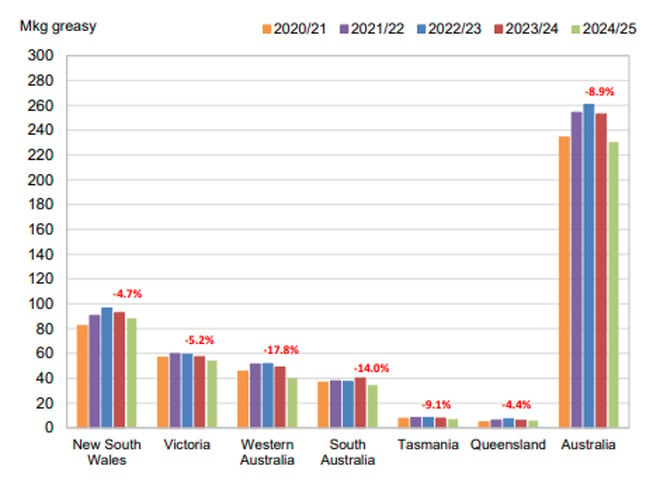
Figure 3: Volume of wool tested (AWTA WSA data) during the 2024/25 season from July to March compared with previous seasons (2020/21 to 2024/25). The percentage change in red font is the 2024/25 season from July to March compared with the same 9 months in the 2023/24 season.
In New South Wales, the greatest volumes of wool tested originated from WSA regions N23 (15.5%), N19 (7.8%), N29 (6.3%), N15 (6.1%) and N03 (5.5%) (Figure 4a). Collectively, these five WSAs represented 41.2% of the total weight of wool tested in New South Wales from July to March during 2024/25 (Figure 4b).
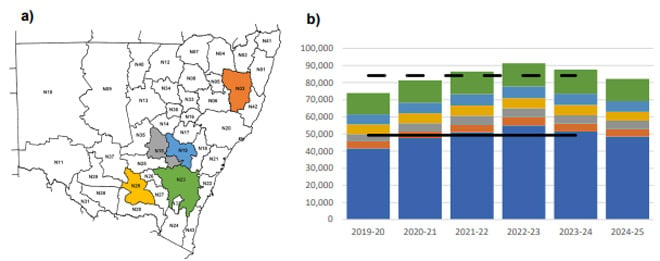
Figure 4: a) The five New South Wales WSA regions from which the greatest volumes of wool tested originated and b) The total wool test volumes for the 2024/25 season July to March compared with previous seasons (2019/20 to 2023/24). The larger blue portion of each column represents the other WSA regions with the coloured bars representing the 5 largest WSA regions: green; light blue; yellow; grey & orange. The continuous black horizontal line represents the 5- year average from 2019/20 to 2023/24 for the other WSAs with the dashed black line the five-year average for the state. Data is in greasy tonnes.
In Victoria, the greatest volumes of wool tested originated from WSA regions V21 (12.4%), V07 (11.3%), V18 (11.2%), V22 (8.8%) and V25 (8.1%) (Figure 5a). Collectively, these five WSAs represented 51.8% of the total weight of wool tested in Victoria from July to March during 2024/25 (Figure 5b).
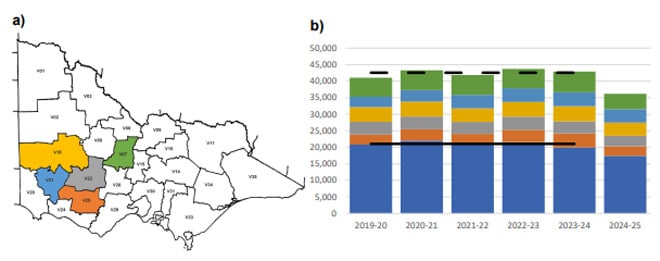
Figure 5: a) The five Victorian WSA regions from which the greatest volumes of wool tested originated and b) The total wool test volumes for the 2024/25 season July to March compared with previous seasons (2019/20 to 2023/24). The larger blue portion of each column represents the other WSA regions with the coloured bars representing the 5 largest WSA regions: green; light blue; yellow; grey & orange. The continuous black horizontal line represents the 5- year average from 2019/20 to 2023/24 for the other WSAs with the dashed black line the five-year average for the state. Data is in greasy tonnes.
In Western Australia, the greatest volumes of wool tested originated from WSA regions W12 (20.6%), W09 (17.0%), W10 (14.1%), W11 (8.4%) and W08 (8.2%) (Figure 6a). Collectively, these five WSAs represented 68.3% of the total weight of wool tested in Western Australia from July to March during 2024/25 (Figure 6b).
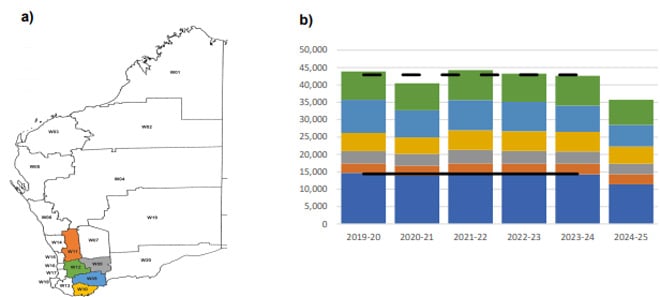
Figure 6: a) The five Western Australian WSA regions from which the greatest volumes of wool tested originated and b) The total wool test volumes for the 2024/25 season July to March compared with previous seasons (2019/20 to 2023/24). The larger blue portion of each column represents the other WSA regions with the coloured bars representing the 5 largest WSA regions: green; light blue; yellow; grey & orange. The continuous black horizontal line represents the 5- year average from 2019/20 to 2023/24 for the other WSAs with the dashed black line the five-year average for the state. Data is in greasy tonnes.
In South Australia, the greatest volumes of wool tested originated from WSA regions S29 (19.5%), S13 (9.0%), S15 (8.8%), S21 (7.1%) and S30 (7.0%) (Figure 7a). Collectively, these five WSAs represented 51.5% of the total weight of wool tested in South Australia from July to March during 2024/25 (Figure 7b).
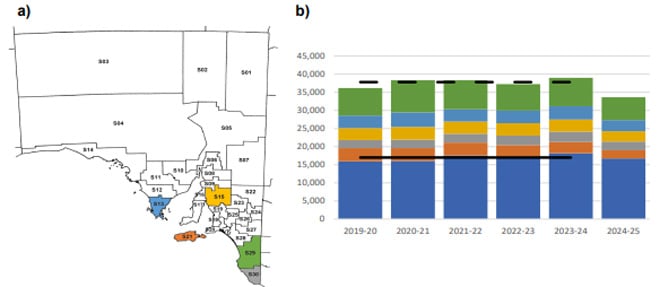
Figure 7: a) The five South Australian WSA regions from which the greatest volumes of wool tested originated and b) The total wool test volumes for the 2024/25 season July to March compared with previous seasons (2019/20 to 2023/24). The larger blue portion of each column represents the other WSA regions with the coloured bars representing the 5 largest WSA regions: green; light blue; yellow; grey & orange. The continuous black horizontal line represents the 5- year average from 2019/20 to 2023/24 for the other WSAs with the dashed black line the five-year average for the state. Data is in greasy tonnes.
In Tasmania, the greatest volumes of wool tested originated from WSA regions T05 (36.2%), T03 (27.7%), T04 (21.2%), T06 (10.8%) and T01 (3.6%) (Figure 8a). Collectively, these five WSAs represented 99.5% of the total weight of wool tested in Tasmania from July to March during 2024/25 (Figure 8b).
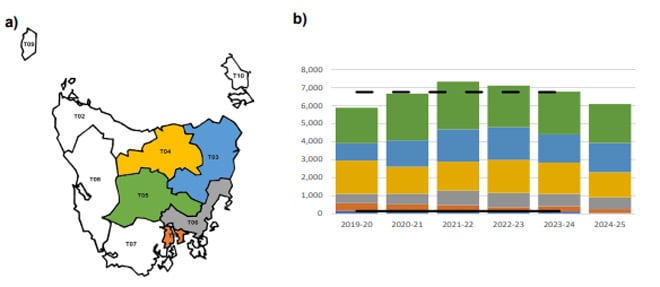
Figure 8: a) The five Tasmanian WSA regions from which the greatest volumes of wool tested originated and b) The total wool test volumes for the 2024/25 season July to March compared with previous seasons (2019/20 to 2023/24). The larger blue portion of each column represents the other WSA regions with the coloured bars representing the 5 largest WSA regions: green; light blue; yellow; grey & orange. The continuous black horizontal line represents the 5- year average from 2019/20 to 2023/24 for the other WSAs with the dashed black line the five-year average for the state. Data is in greasy tonnes.
In Queensland, the greatest volumes of wool tested originated from WSA regions Q12 (21.3%), Q15 (10.8%), Q23 (10.3%), Q21 (7.5%) and Q22 (6.6%) (Figure 9a). Collectively, these five WSAs represented 56.6% of the total weight of wool tested in Queensland from July to March during 2024/25 (Figure 9b).
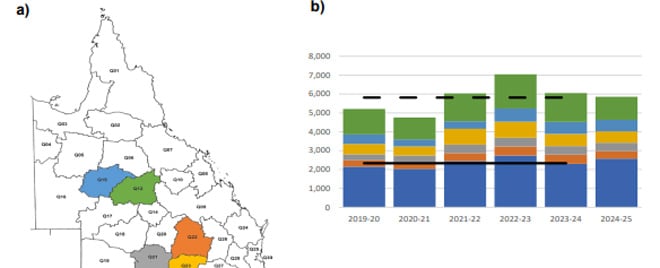
Figure 9: a) The five Queensland WSA regions from which the greatest volumes of wool tested originated and b) The total wool test volumes for the 2024/25 season July to March compared with previous seasons (2019/20 to 2023/24). The larger blue portion of each column represents the other WSA regions with the coloured bars representing the 5 largest WSA regions: green; light blue; yellow; grey & orange. The continuous black horizontal line represents the 5- year average from 2019/20 to 2023/24 for the other WSAs with the dashed black line the five-year average for the state. Data is in greasy tonnes.
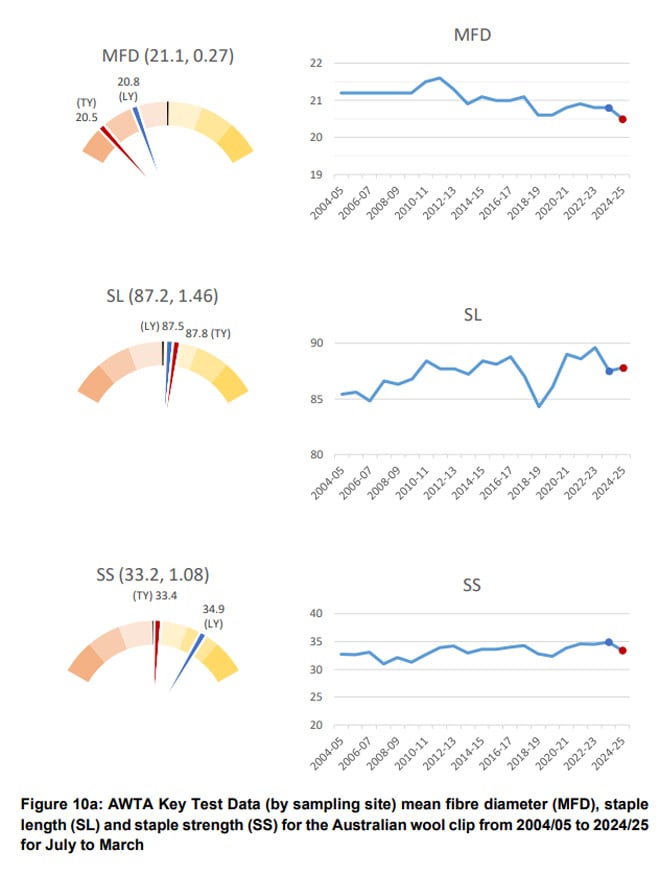
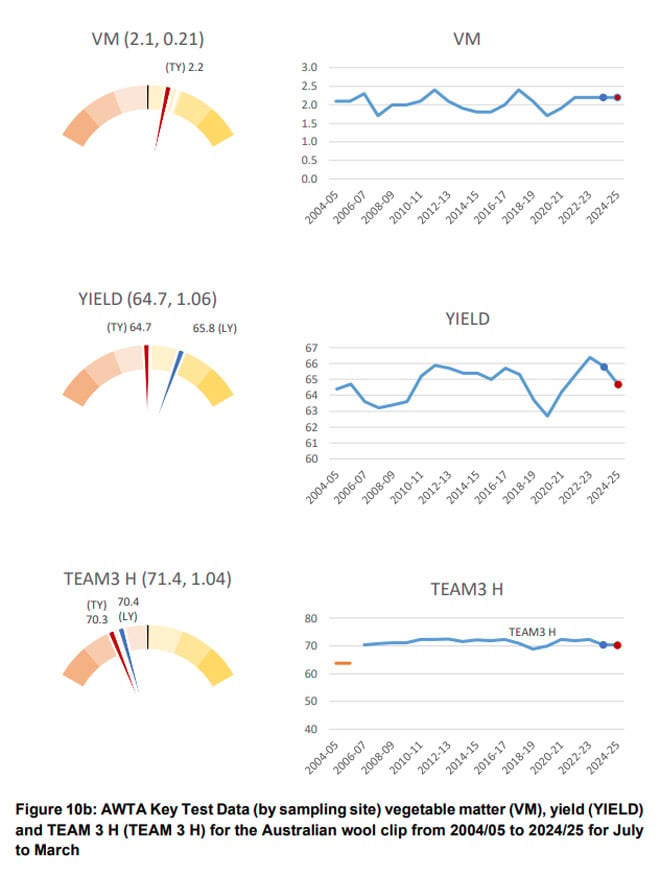
A graphical representation of the AWTA Key Test Data changes in mean fibre diameter (MFD), vegetable matter (VM), staple length (SL), yield (YIELD), staple strength (SS) and hauteur (TEAM 3 H) from the 2004/05 to the 2024/25 season July to March is shown in Figure 10. On each graph the red dot represents the mean value of each characteristic for the 2024/25 season July to March while the blue dot represents the mean for the 2023/24 season July to March. The values above the gauge on the left-hand side of each graph show the mean and standard deviation respectively for that characteristic from 2004/05 to 2024/25 July to March. Each coloured segment on the gauges represents one standard deviation with the mean at 12 o-clock (centre). For MFD, VM, SL, YIELD and SS, the mean and standard deviation are based on data from the 2004/05 season onwards. For TEAM 3 the mean and standard deviation are based on data from the 2006/07 season onwards. The red line on each gauge is the mean for the 2024/25 season July to March (TY), while the blue line is the mean for the 2023/24 season July to March (LY).
- On a national basis, compared with the 2023/24 season July to March, mean fibre diameter was 20.5 microns down 0.3 microns, staple length was up 0.3 mm to 87.8 mm and staple strength was down 1.5 N/ktex to 33.4 N/ktex (Figure 10a).
- Vegetable matter was unchanged at 2.2%, yield was down 1.1% to 64.7% and predicted hauteur (TEAM 3) was down 0.1 mm to 70.3 mm (Figure 10b).
AWEX auction statistics
The AWEX first-hand auction statistics for the 2024/25 to week 40 were 9.1% lower than the same time in 2023/24 (Table 5).
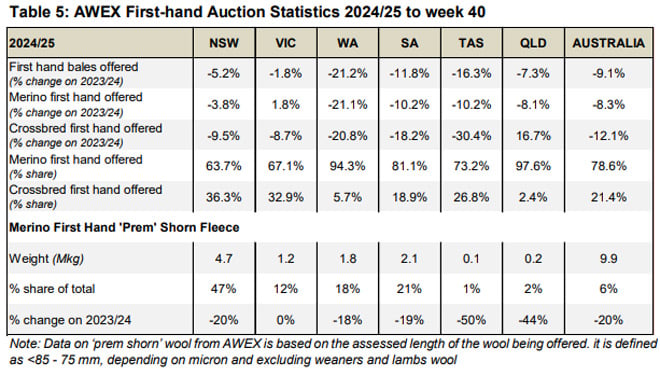
- First-hand bales offered decreased in all states, Western Australia (down 21.2%),
Tasmania (down 16.3%), South Australia (down 11.8%), Queensland (down 7.3%), New
South Wales (down 5.2%) and Victoria (down 1.8%) (Table 5). - The volume of first-hand Merino wool offered across Australia decreased by 8.3% with the
volume of first-hand Crossbred wool offered down 12.1%. The share of Merino wool of all
first-hand offered wool was 78.6% in 2024/25 to week 40, compared with 77.8% in 2023/24
and 78.9% in 2022/23 for the corresponding sale weeks. - There was a 20% decrease in the volume of ‘Prem-shorn’ Merino fleece wool in 2024/25
to week 40 (9.9 Mkg) compared with 2023/24 to week 40 (12.4 Mkg). - As a percentage share of the total first-hand wool offered, 6% of Australian first-hand bales
offered were prem shorn in 2024/25 to week 40. On a state-by-state basis this ranged from
1% in Tasmania to 47% in New South Wales.
Australian Bureau of Statistics (ABS) data
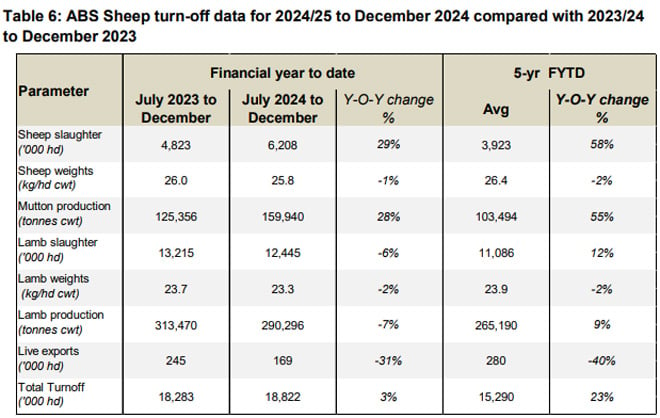
Sheep turn-off Australian sheep and lamb turn-off statistics during July to December 2024 are shown in Table 6:
- There was a 29% increase in sheep slaughter, and a 6% decrease in lamb slaughter compared with the same six months in 2023/24.
- Sheep slaughter was 58% above the five-year average with lamb slaughter 12% higher than the five-year average.
- The number of live sheep exported from Australia decreased by 31% between July to December 2024 and were 40% below the five-year average.
- Total turnoff of sheep and lambs between July and December 2024 was 3% higher than
the same six months in 2023/24 and 23% above the five-year average.
Bureau of Meteorology (BoM) seasonal rainfall seasonal outlook
Seasonal conditions during the 2024/25 were average to below average in the key wool producing regions in Western Australia, South Australia, Victoria and Tasmania (Figure 11). The major wool producing regions in South Australia and Victoria had very much below average to lowest on record rainfall deciles. The main wool producing regions in New South Wales received average to below average rainfall. Queensland received above average to very much above average rainfall due to significant widespread rainfall in March.
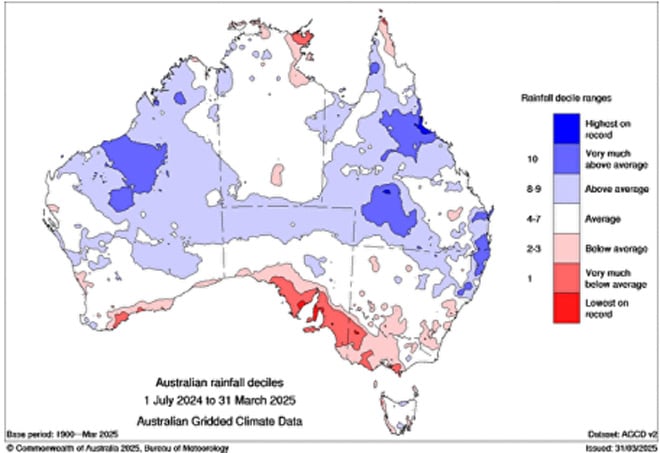
Figure 11: Australian rainfall deciles, 2024/25 season July to March
The landscape water balance in the major wool producing regions reflects seasonal conditions and rainfall (Figure 12).
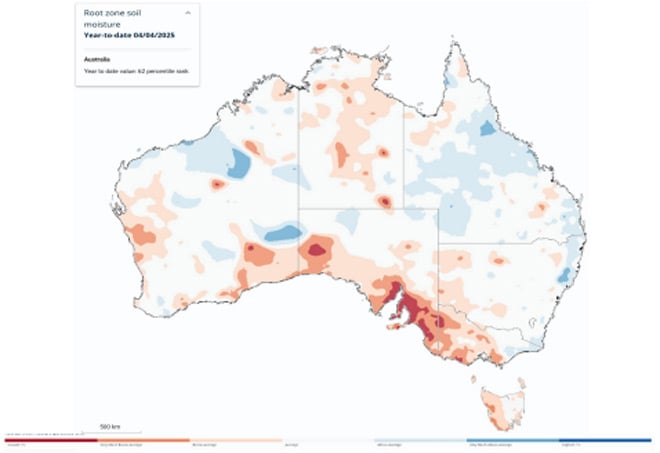
Figure 12: Australian landscape water balance, at 4 April 2025 (Source: Bureau of Meterology)
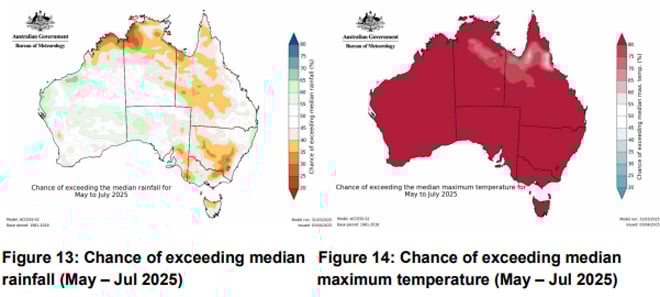
The Bureau of Meteorology’s outlook for May to July 2025 is for average to above average median rainfall for Western Australia and western and central regions of South Australia (Figure 13). Below median rainfall is forecast in the key wool producing regions of New South Wales, South Australia, Victoria, Queensland and Tasmania. Above average median maximum temperatures are likely to very likely (60 to greater than 80% chance) for most of the southern two-thirds of Australia (Figure 14).
State Committee input
The following provides a summary of seasonal conditions and the wool production forecast for 2024/25 as reported by the AWPFC state committees in April 2025.
New South Wales
Mixed seasonal conditions across the state. Some local bands of storms during summer produced reasonable feed while other areas are dry. Good rains in the north of the state and parts of the west. Some impacts of flooding in western regions as water flows south from the March rainfall event in Queensland. Germination has occurred in western regions but follow up rain is required to continue growth. The Central Tablelands and regions south of the Newell Highway are dry as is the Monaro. Continued high temperatures will further deplete soil moisture, however this is providing an increased, albeit short, window for pasture growth if it rains soon. Stock water is reducing in some regions. Sheep feeding is underway in many regions. Mixed farming regions are looking for the autumn break to begin sowing.
Destocking is occurring in northeastern regions, with sheep producers looking at other options. The wet summer has increased the risk of worm infection with larval populations surviving the summer and increasing resistance to available drenches. Accessing the necessary labour to drench more frequently is an increasing issue. A higher number of terminal rams are being joined to Merino flocks, with many properties switching to cattle.
Sheep producers continue to focus on high input costs and labour availability, although shearing teams are easier to access due to fewer sheep in some regions. Producer sentiment continues to be negative, those with debt are being impacted by interest rates.
Prices for the broader end of the clip have increased, although those for the finer end of the Merino micron range remain a concern. Test volumes for crossbred wools have decreased due to a move to shedding breeds. There is some indication of a swing back to Merino production from composites or shedding breeds in some areas whilst others increase cropping or cattle. No major year-on-year change reported in brokers receivals. Wool stocks held on farm are not likely to be significant. The number of bales sold is higher due to older wool stocks being sold into the higher market due to unknown impact of global trade uncertainty on fibre markets and livestock prices.
Sheep numbers are expected to be lower and per head production is likely to reduce, although lower yields (particularly in southern regions) will increase the average greasy cut per head. Mutton sales continue to be strong, with many sheep sold carrying wool due to high skin values.
Shearing contractors report shearing similar number of sheep as last season, but fewer lambs shorn. Some cropping failures in 2024 have increased interest in livestock, but limited feed crops have been planted due to the dry conditions. Most producers have set their sheep calendar for 2025 and will retain numbers and feed. Hay and cereal stocks from 2024 are available. The New South Wales Committee’s fourth forecast of shorn wool production for 2024/25 is 110.0 Mkg greasy, down 7.9% on 2023/24.
Victoria
Very dry conditions persist across most of Victoria, particularly in the central to western regions which produce the bulk of the state’s clip. Some localised rainfall occurred in southern regions but it was not enough to make a material difference. Paddocks are dry with no feed; limited stubble remains in some areas. Full hand feeding of stock is continuing in many regions with numerous producers now carting water for their livestock. A lack of staff to manage feeding and stock water carting together with the current cost of grain and hay is promoting further stock disposal. Sheep producer sentiment is extremely negative, carting stock water is expected to bring decisions regarding further flock reduction forward. Some eastern regions of the state have fared much better with green feed available and sheep in good condition, but these regions contribute low volumes to the state’s overall shorn wool production.
Wool producers have moved stock off paddocks into containment and sold additional age groups. Sheep sales are being made to processors with very few sheep sold as re-stockers. Producers in some regions have cut back to 2 age groups. Some producers are holding onto younger ewes, but these are the minority. The low demand for surplus ewes is prompting many producers to finish ewe lambs for slaughter that would normally be retained for breeding.
Wool is being sold earlier than last season as January rain delayed shearing in 2024 and producers are seeking to cover feed costs and offering their clips for sale in response to the improved market prices in 2025.
The AWTA WSA data indicate year on year percentage decreases across most Merino and crossbred micron categories with the Key Test Data reflective of the dismal season. MFD was down 0.5 µm to 21.4 µm (a 20-year low) SL down 0.3 mm to 88.5 mm, SS down 2N/ktex to 34.1 N/ktex. The Victorian Committee’s fourth forecast of shorn wool production for 2024/25 is 59.5 Mkg greasy, down 9.3% on 2023/24.
Western Australia
An average season across most of the state. Northern agricultural regions remain dry, with a recent welcome break of the season rain in southern regions. Cropping and grazing enterprises have had a good start in terms of soil moisture for sowing, pasture emergence and growth. A lack of stock water in the first part of the season contributed to further flock disposals, it is unknown how many of these properties will restock now many on-farm stock water supplies have been replenished by recent rain.
Ewes were generally in good condition at joining due to reasonable quantities of quality dry feed. Scanning percentages have been variable, early scanning results were low due to heat during December and January. Later joinings were not as affected, however lambing percentages are expected to be lower than last year. While pregnant ewe numbers are expected to begin to stabilise, a high number of Merino ewes joined to terminal sires is expected to significantly reduce the number of Merino hoggets for joining in 2025/26. Crossbred lambs are being finished for slaughter rather than retained as breeders, further depleting future breeding ewe numbers.
Empty ewes continue to be sold for processing due to high mutton prices. Wool cuts have generally increased due to reasonable quantities of quality dry feed over summer and into autumn. Apart from finer wool, on-farm wool and brokers stocks of fresh wool are thought to be reasonably low.
AWTA KTD show FD and SS both at 20-year lows (18.8 µm and 28.1 N/ktex) respectively with SL, VM and yield close to the 20-year average. Apart from July-24 (+3.6%), monthly wool test volumes were lower than those in 2023/24 by between -4.2 to -31.5%. The Western Australian Committee’s fourth forecast of shorn wool production for 2024/25 is 44.9 Mkg greasy, down 18.4% on 2023/24
South Australia
Pastoral zones across the north of the state are not too bad and sheep production is expected to be maintained. Lambing rates in the northwest have been good. although more properties have moved into shedding breeds. Dams are drying up on properties in the northwest, very high goat numbers are competing with Merino ewes and lambs for limited water reducing lambing percentages.
Extremely dry throughout the rest of the state, little to no effective rainfall in key wool producing regions since the December meeting. Paddock feed is sparse to non-existent with full hand feeding of stock in many regions. Stocks of feed are becoming difficult to source. The current drought situation is worse than the previous dry which occurred in 2005/06. Properties with mains water or bores have sufficient stock water with some reports of dry dams in the southeast and the Adelaide Hills.
Containment feeding has been underway in since late spring. Producers are weighing up retaining new season lambs to grow out for the young ewe market or selling to capture current lamb prices and high skin value. Sheep, crossbreds and Merino, are being sold in the wool due to the cost of shearing. Processing capacity is limited due to the volume of sheep being turned off. Few sheep being sold as re-stockers.
Fewer ewes were joined due to the critical feed situation. Empty sheep are being sold following scanning. Pregnancy scanning rates are mixed across the state according to producers’ ability to feed ewes. Those who are containment feeding and able to maintain condition score had good scanning rates. Reports of few empty ewes and a high proportion of twins.
Lambing has commenced in some regions, with older age groups of ewes are being sold to focus limited feed on finishing lambs for sale.
Shearing is on track or early in many regions due to the dry conditions and to lighten the load on stock and reduce feed requirements. Shearing is largely complete in the southeast. Yields in some regions are expected to decrease by up to 10% with yield decreases of 3-5% in ’better’ areas. VM levels are expected to increase in pastoral regions but decrease in all other areas. AWTA KTD show a 0.2 µm reduction in MFD to 20.4 µm (a 20-year low) and a 1.5mm decrease in SL to 89.3mm. Wool cuts will be lower than 2023/24.
Producers are meeting the market and selling clips to generate some cash flow. Stock held over from last spring are coming into wool stores to be sold. The South Australian Committee’s fourth forecast of shorn wool production for 2024/5 is 47.3 Mkg greasy, down 18.4% on 2023/24.
Tasmania
A wet December through much of the state but average to dry conditions since then. Carry over feed from the wet December has maintained sheep through to Autumn. Some regions had 20mm in March but no further rain since then. The patchy rain produced some pasture germination, but this failed without follow up rain. Feeding is underway as the country is now bare. A tough winter is expected.
Autumn shorn wools will be less affected than spring shorn. Sheep numbers are expected to steady for the next few months, retained sheep will be shorn and joined. Producers are expected to make further decisions regarding sheep numbers in spring.
Producers have mated a higher number of Merino ewes to terminal rams. Autumn ram sales confirmed this with terminal sires being sold in high numbers. Fewer hogget Merino ewes will be available for joining next season. The number of shedding sheep in the flock has increased which is changing the fibre diameter profile of the Tasmanian clip. This is seen as a short-term solution to improve cash flow. A recovery in the wool market will see a move back to Merino production.
Lambing and marking rates during the season have been average.
Mutton and lamb turnoff has been reasonably high with improved skin values limiting pre-sale shearing. Less prem-shorn wool is expected as a result. Little to no difference in stored wool either on farm or in brokers stores compared with last season. The Tasmanian Committee’s fourth forecast of shorn wool production for 2024/25 is 9.2 Mkg greasy, down 1.1% on 2023/24.
Queensland
The tough summer conditions in key wool producing regions reported in December continued with feeding on-going in many regions (some producers have been feeding since April 2024). The long, hot dry period (8 months) is expected to lower per head production. Feed quality reduced with the ‘protein drought’ reducing fibre diameter to 19.1 µm (a 20-year low) and sheep condition. Poor scanning results have been reported with lower lambing percentages and lighter lamb weights expected. Reports of large number of wild dogs in many regions prior to the March 2025 flood event.
Improvement in goat value has seen some producers invest additional resources into trapping, mustering and sale of feral goats.
Producer sentiment remains negative. Large move to shedding breeds in Q12, where most Queensland WSA wool test volumes originate, with 40% of sheep in the region estimated to be Dorpers. Whole flocks are moving out of Merinos as part of a generational change. Properties which previously traded Merino wethers have moved entirely to Dorpers.
A major rainfall event occurred in mid-March resulting in widespread flooding. Total stock losses remain to be determined as many producers are not yet able to make a definitive count. Significant infrastructure loss and damage in flooded regions including exclusion fencing, internal fences, dams (either silted up or walls washed away) and roads (both regional and on-property). Some flock disposal is occurring where exclusion fences have been damaged as they can’t be repaired and dog numbers controlled prior to lambing.
While most shearing occurs between July and September, any remaining shearing is expected to be delayed by 3 - 4 weeks which will push some June test volumes into July. The Queensland Committee’s fourth forecast of shorn wool production for 2024/25 is 9.2 Mkg greasy, down 8.9% on 2023/24.
Appendix
Table A1: Comparison of shorn wool production in 2023/24 against the 2022/23 season and the fourth forecast for 2024/25 against the 2023/24 season
At their September 2022 meeting, the AWPFC National Committee resolved to include a clean estimate of shorn wool production based on the yield (%, Schlumberger dry top and noil yield) from the AWTA key test data for each complete season.
Historical Australian Production Figures
The tables below provide historical sheep shorn numbers, wool production, fleece weight and micron share statistics since 1991/92 for background information.
Table A2: Australian wool production statistics since 1991/92
At their September 2022 meeting, the AWPFC National Committee resolved to include a clean estimate of shorn wool production for each full season based on the yield (%, Schlumberger dry top and noil yield) from the AWTA key test data for that season.
Explanation of revised AWPFC data series
At the December 2005 meeting, the National Committee made the decision to collate and review the key variables (shorn wool production, cut per head, number of sheep shorn) used in the committee from the available industry sources and to create a consistent historical data series at both a state and national level. This was required as some differences existed between industry accepted figures and the AWPFC data series and to ensure a consistent methodology over time. This process resulted in changes to the parameters ‘average cut per head’ and the ‘number of sheep shorn’ for some seasons at both a state and national level.
Modus operandi for the Australian Wool Production Forecasting Committee
The Australian Wool Production Forecasting Committee draws together a range of objective data and qualitative information to produce consensus-based, authoritative forecasts four times a year for Australian wool production.
The Committee has a two-level structure, with a National Committee considering information and advice from state committees. It is funded by Australian Wool Innovation Limited, which also provides a representative in the role of the Chairman of the National Committee.
The National and state committees comprise wool producers, wool brokers, exporters, processors, private treaty merchants, AWEX, AWTA, ABARES, ABS, MLA, state departments of Agriculture, sheep pregnancy scanners and AWI.
The Committee releases its forecasts in the forms of a press release and a report providing the detailed forecasts, historical data and commentary on the key drivers of the forecasts.