Australian Wool Production Forecast Report December 2025
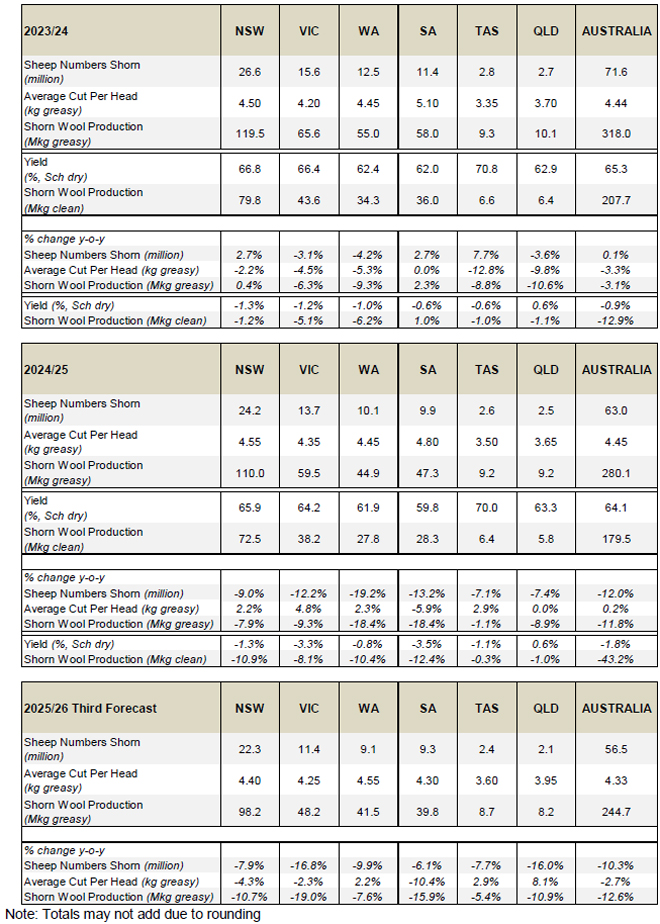
The Australian Wool Production Forecasting Committee’s (AWPFC) third forecast of shorn wool production for the 2025/26 season is 244.7 Mkg greasy. This is 12.6% lower than the 2024/25 estimate and a 6.9 Mkg greasy downward revision of the August 2025 forecast.
Summary
- The Australian Wool Production Forecasting Committee’s (AWPFC) third forecast of shorn wool production for the 2025/26 season is 244.7 Mkg greasy. This is 12.6% lower than the 2024/25 estimate and a 6.9 Mkg greasy downward revision of the August 2025 forecast.
- A year-on-year decline in shorn wool production in 2025/26 was forecast for all states ranging from -19.0% in Victoria (48.2 Mkg greasy) to -5.4% (8.7 Mkg greasy) in Tasmania. New South Wales is forecast to produce 98.2 Mkg greasy (down 10.7%), Western Australia 41.5 Mkg greasy (down 7.6%), South Australia 39.8 Mkg greasy (down 15.9%) and Queensland 8.2 Mkg greasy (down 10.9%).
- Average cut per head is forecast to be 4.33 kg greasy (down 2.7%). AWTA key test data for the 2025/26 season to the end of November show no change in mean fibre diameter (20.1 μm) or vegetable matter (2.2%), a 0.1 mm increase in staple length (89.4 mm), 1.2 N/ktex reduction in staple strength (33.5 N/ktex) and a 0.6% reduction in yield (64.3%).
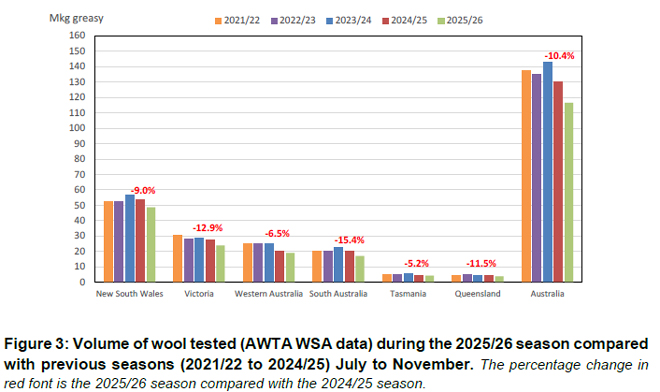
- AWTA wool test volumes (greasy weight) for the 2025/26 season to the end of November were down by 10.4% on a year-on-year basis. Firsthand wool offered at auction during 2025/26 to the end of November was down by 3.9%.
- Sheep and lamb slaughter from July to September 2025 were down 26% and 18% respectively compared with the same time in 2024, but sheep slaughter was still 11% above the five-year July to September average, and lamb slaughter 10% below. Based on ABS slaughter numbers, mutton and lamb production, both sheep and lamb weights were higher than the September quarter in 2024.
- The October 2025 Sheep Producer Intentions Survey indicated an improvement in sentiment among both wool and sheepmeat producers due improvement in seasonal conditions, commodity prices and international market opportunities for sheep meat.
- The Bureau of Meteorology’s outlook for December 2025 to February 2026 is for below average rainfall for parts of the west and inland parts of the east. For most of the east coast of Australia, and across the southern states, there was no clear signal in the rainfall forecast, meaning roughly equal chances of above or below media rainfall to the end of February. Wamer than average days and nights are likely across most of Australia.
- Table 1 summarises Australian wool production and Table 2 shows the total shorn wool production by state. Table 3 provides a comparison of AWTA key test data for the 2024/25 and 2025/26 seasons (July to November)
- More detailed information on the shorn wool production by state in 2025/26 can be found in Table A1 in the Appendix to this report.
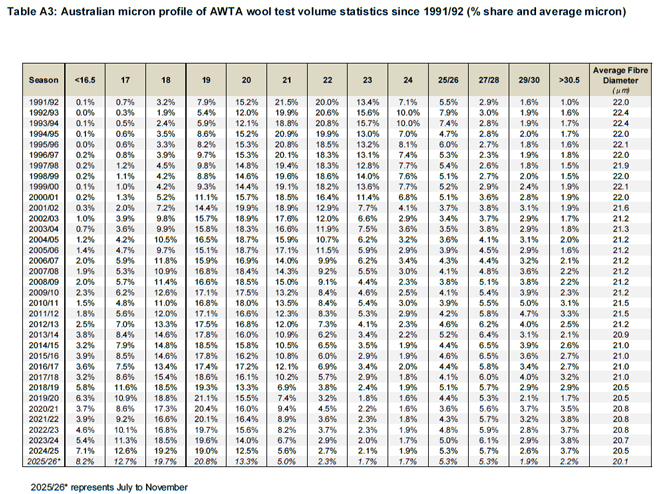
- The Appendix also provides historical data for Australia, including sheep shorn numbers, average cut per head and shorn wool production (Table A2) as well as the micron profile (Table A3) since 1991/92.
Detail on shorn wool production in 2025/26
Major data inputs
The AWPFC forecasts are based on detailed consideration by the state and national committees of data from various sources including:
- AWTA wool test data for the 2025/26 season July to November 2025;
- AWEX first-hand auction statistics for the 2025/26 season July to November 2025 (Week 22);
- ABS sheep and lamb turn-off for the 2025/26 season July to September 2025;
- Information on current and expected seasonal conditions from the Bureau of Meteorology;
- Survey information from the MLA/AWI Sheep Producer Intentions Survey conducted in October 2025.
AWTA wool test data
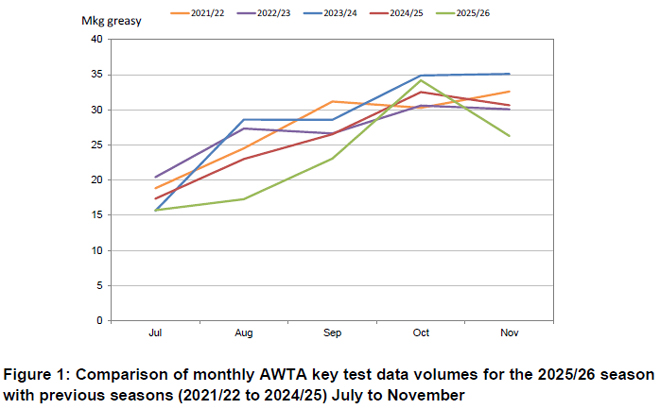
Every month AWTA releases data on the volumes of greasy wool tested within the various diameter categories for the month and the season to date. Data for the 2025/26 season July to November are compared with previous seasons (2021/22 to 2024/25) in this report.
The month-by-month comparison of wool tested during the 2025/26 season July to November show test volumes below the past four seasons from July to September and in November. October test volumes were second only to 2023/24 (Figure 1).
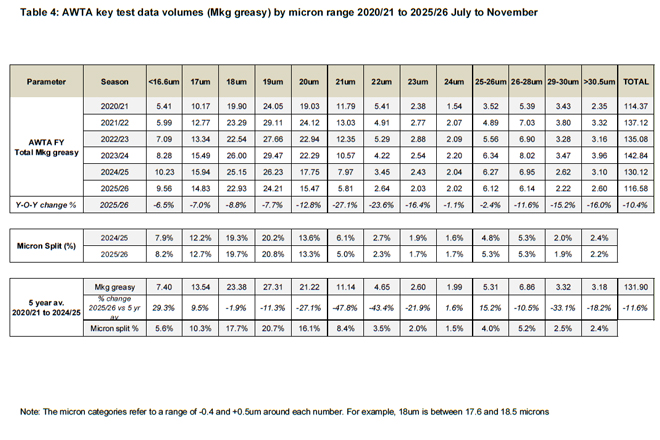
AWTA national wool test volumes data for the 2025/26 season July to November (Table 4) show:
- Volumes of wool tested were 10.4% lower than the 2024/25 season July to November at 116.58 Mkg greasy. This was 11.6% lower than the five-year average from 2020/21 to 2024/25 July to November.
- The weight of wool tested in all micron categories, decreased by between 1.1% (24 microns) and 27.1% (21 microns) compared with 2024/25 July to November.
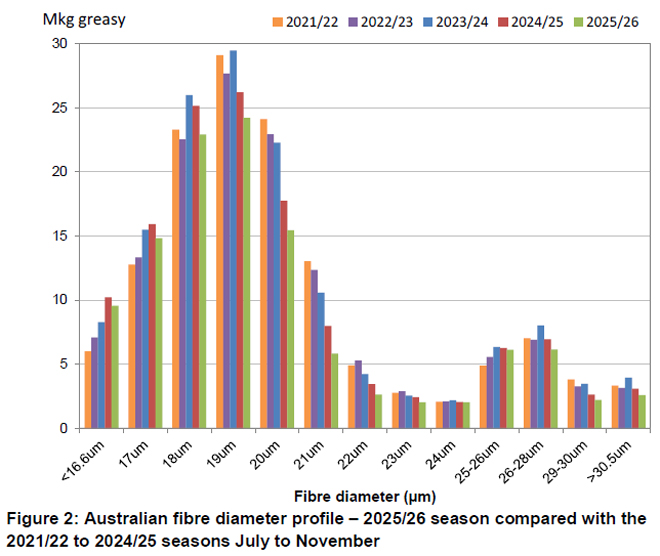
- The largest micron categories by volume were the 19-micron (24.2 Mkg greasy), 18-micron (22.9 Mkg greasy) and 20-micron (15.5 Mkg greasy) categories.
- The micron split (% of total weight of wool tested) during 2025/26 July to November showed small increases in the finer (i.e. less than 19 microns) end of the micron range. The difference across the micron categories in comparison to the 2024/25 season July to November ranged from -1.1% (21 microns) to +0.6% (19.0 microns).
The micron profile of the Australian wool clip continues to have two distinct peaks. One centred around 18- to 19-micron wool (finer than 16.6 microns up to 23 microns) and a second centred around 26 - 28 microns (from 24 microns to 30.5 microns and broader) (Figure 2).
A historical comparison of the Australian wool clip’s micron profile percentage share and average micron can be found in Appendix Table A3 (at the end of this report).
Based on data by Wool Statistical Area (WSA), the volumes of wool tested during 2025/26 July to November decreased in all states (Figure 3). South Australia had the greatest decrease in the volume of wool tested (down 15.4%), followed by Victoria (down 12.9%), Queensland (down 11.5%), New South Wales (down 9.0%), Western Australia (down 6.5%) and Tasmania (down 5.2).
In New South Wales, the greatest volumes of wool tested originated from WSA regions N23 (11.5%), N19 (8.2%), N03 (6.9%), N15 (6.1%) and N29 (5.7%) (Figure 4a). Collectively, these five WSAs represented 38.4% of the total weight of wool tested in New South Wales during 2025/26 July to November (Figure 4b).
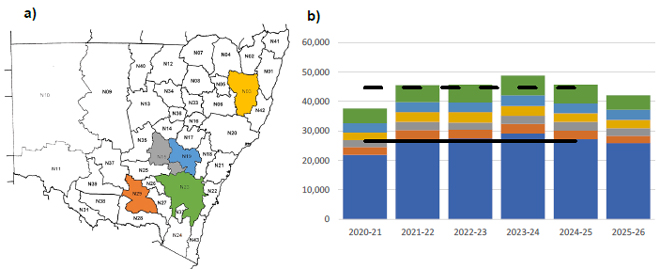
Figure 4: a) The five New South Wales WSA regions from which the greatest volumes of wool tested originated and b) The total wool test volumes for the 2025/26 season compared with previous seasons (2020/21 to 2024/25) July to November. The larger blue portion of each column represents the other WSA regions with the coloured bars representing the 5 largest WSA regions: green; light blue; yellow; grey & orange. The continuous black horizontal line represents the 5-year average from 2020/21 to 2024/25 July to November for the other WSAs with the dashed black line the five-year average for the state. Data is in greasy tonnes.
In Victoria, the greatest volumes of wool tested originated from WSA regions V07 (14.8%), V18 (10.7%), V22 (8.5%), V21 (8.3%) and V05 (6.9%) (Figure 5a). Collectively, these five WSAs represented 49.2% of the total weight of wool tested in Victoria during 2025/26 July to November (Figure 5b).
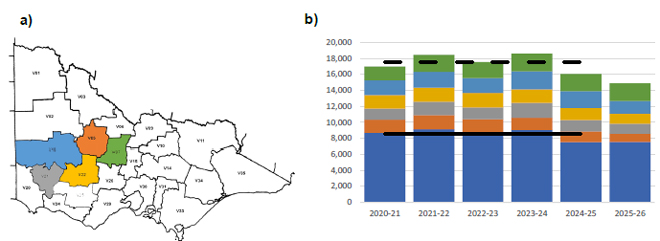
Figure 5: a) The five Victorian WSA regions from which the greatest volumes of wool tested originated and b) The total wool test volumes for the 2025/26 season compared with previous seasons (2020/21 to 2024/25) July to November. The larger blue portion of each column represents the other WSA regions with the coloured bars representing the 5 largest WSA regions: green; light blue; yellow; grey & orange. The continuous black horizontal line represents the 5-year average from 2020/21 to 2024/25 July to November for the other WSAs with the dashed black line the five-year average for the state. Data is in greasy tonnes.
In Western Australia, the greatest volumes of wool tested originated from WSA regions W09 (17.7%), W12 (16.4%), W07 (10.3%), W10 (10.3%) and W11 (9.2%) (Figure 6a). Collectively, these five WSAs represented 63.9% of the total weight of wool tested in Western Australia during 2025/26 (Figure 6b).
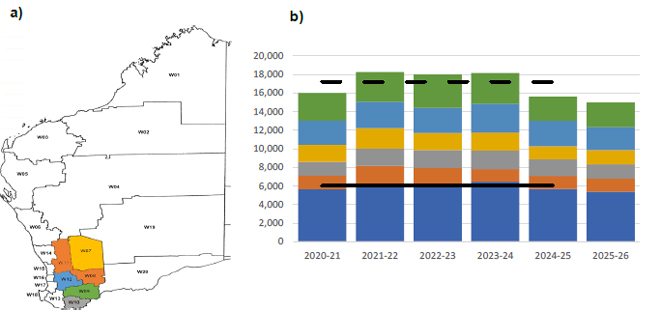
Figure 6: a) The five Western Australian WSA regions from which the greatest volumes of wool tested originated and b) The total wool test volumes for the 2025/26 season compared with previous seasons (2020/21 to 2024/25) July to November. The larger blue portion of each column represents the other WSA regions with the coloured bars representing the 5 largest WSA regions: green; light blue; yellow; grey & orange. The continuous black horizontal line represents the 5-year average from 2020/21 to 2024/25 July to November for the other WSAs with the dashed black line the five-year average for the state. Data is in greasy tonnes.
In South Australia, the greatest volumes of wool tested originated from WSA regions S29 (19.4%), S15 (9.8%), S13 (9.2%), S30 (6.3%) and S27 (5.2%) (Figure 7a). Collectively, these five WSAs represented 49.7% of the total weight of wool tested in South Australia during 2025/26 July to November (Figure 7b).
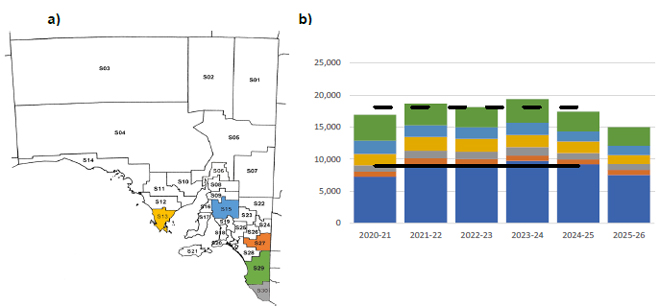
Figure 7: a) The five South Australian WSA regions from which the greatest volumes of wool tested originated and b) The total wool test volumes for the 2025/26 season compared with previous seasons (2020/21 to 2024/25). The larger blue portion of each column represents the other WSA regions with the coloured bars representing the 5 largest WSA regions: green; light blue; yellow; grey & orange. The continuous black horizontal line represents the 5-year average from 2020/21 to 2024/25 July to November for the other WSAs with the dashed black line the five-year average for the state. Data is in greasy tonnes.
In Tasmania, the greatest volumes of wool tested originated from WSA regions T05 (31.1%), T03 (28.9%), T04 (24.8%), T06 (11.1%) and T01 (3.4%) (Figure 8a). Collectively, these five WSAs represented 99.3% of the total weight of wool tested in Tasmania during 2025/26 July to November (Figure 8b).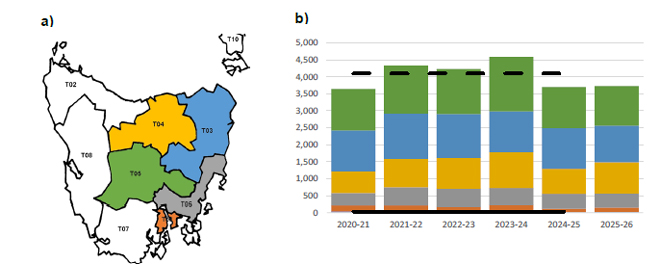
Figure 8: a) The five Tasmanian WSA regions from which the greatest volumes of wool tested originated and b) The total wool test volumes for the 2025/26 season compared with previous seasons (2020/21 to 2024/25) July to November. The larger blue portion of each column represents the other WSA regions with the coloured bars representing the 5 largest WSA regions: green; light blue; yellow; grey & orange. The continuous black horizontal line represents the 5-year average from 20120/21 to 2024/25 July to November for the other WSAs with the dashed black line the five-year average for the state. Data is in greasy tonnes.
In Queensland, the greatest volumes of wool tested originated from WSA regions Q12 (23.3%), Q23 (13.1%), Q15 (10.9%), Q14 (6.5%) and Q17 (5.9%) (Figure 9a). Collectively, these five WSAs represented 59.6% of the total weight of wool tested in Queensland during 2025/26 July to November (Figure 9b).
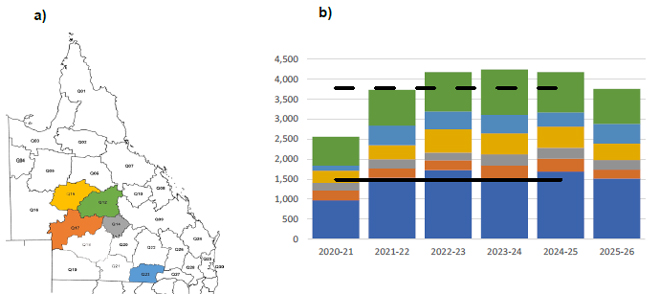
Figure 9: a) The five Queensland WSA regions from which the greatest volumes of wool tested originated and b) The total wool test volumes for the 2025/26 season compared with previous seasons (2020/21 to 2024/25) July to November. The larger blue portion of each column represents the other WSA regions with the coloured bars representing the 5 largest WSA regions: green; light blue; yellow; grey & orange. The continuous black horizontal line represents the 5-year average from 2020/21 to 2024/25 July to November for the other WSAs with the dashed black line the five-year average for the state. Data is in greasy tonnes.
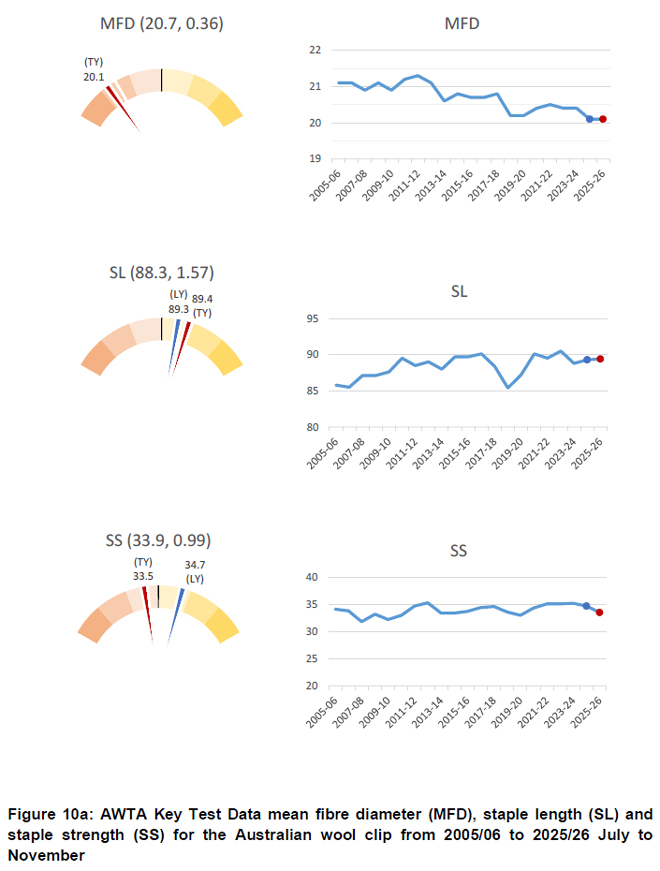
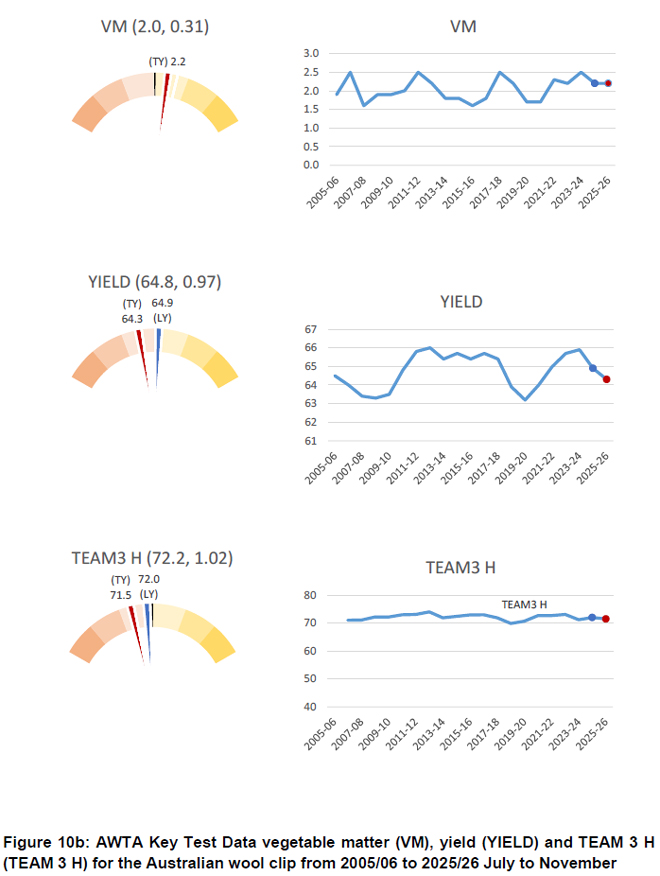
A graphical representation of the AWTA Key Test Data changes in mean fibre diameter (MFD), vegetable matter (VM), staple length (SL), yield (YIELD), staple strength (SS) and hauteur (TEAM 3 H) from the 2005/06 to the 2025/26 season July to November is shown in Figure 10. On each graph the red dot represents the mean value of each characteristic for the 2025/26 season while the blue dot represents the mean for the 2024/25 season July to November. The values above the gauge on the left-hand side of each graph show the mean and standard deviation respectively for that characteristic from 2005/06 to 2025/26. Each coloured segment on the gauges represents one standard deviation with the mean at 12 o-clock (centre). For MFD, VM, SL, YIELD and SS, the mean and standard deviation are based on data from the 2005/06 season onwards. For TEAM 3 the mean and standard deviation are based on data from the 2006/07 season onwards. The red line on each gauge is the mean for the 2025/26 season (TY), while the blue line is the mean for the 2024/25 season (LY) July to November.
- On a national basis, compared with the 2024/25 season July to November, mean fibre diameter was unchanged at 20.1 microns, staple length was up 0.5 mm to 89.4 mm and staple strength was down 1.2 N/ktex to 33.5 N/ktex (Figure 10a).
- Vegetable matter was unchanged at 2.2%, yield was down 0.6% to 64.3% and predicted hauteur (TEAM 3) was down 0.5 mm to 71.5 mm (Figure 10b).
AWEX auction statistics
The AWEX first-hand auction statistics for the 2025/26 season July to November were 3.9% lower than the same time in 2024/25 (Table 5).
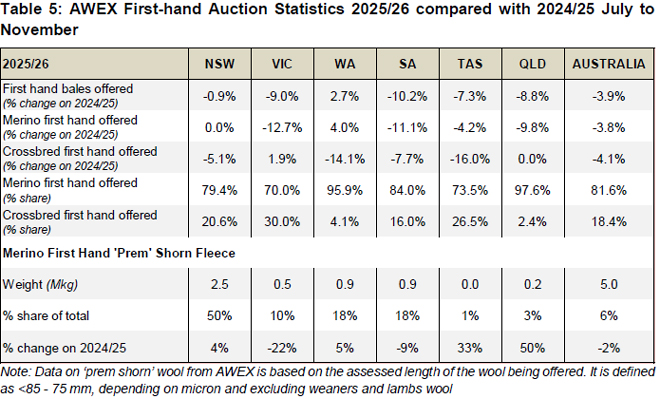
- First-hand bales offered decreased in all states, except Western Australia which increased by 2.7%. South Australia had the greatest decrease (down 10.2%), followed by Victoria (down 9.0%), Queensland (down 8.8%), Tasmania (down 7.3%) and New South Wales (down 0.9%) (Table 5).
- The volume of first-hand Merino wool offered across Australia between July to November 2025 decreased by 3.8% compared with 2024/25 with the volume of first-hand Crossbred wool offered down 4.1%. The share of Merino wool of all first-hand offered wool was 81.6% in 2025/26, compared with 81.5% in 2023/24 and 80.7% in 2022/23 July to November.
- There was a 2% decrease in the volume of ‘Prem-shorn’ Merino fleece wool in 2025/26 (5.0 Mkg) compared with 2024/25 (5.1 Mkg).
- As a percentage share of the total first-hand wool offered, 6% of Australian first-hand bales offered were prem shorn in 2025/26. On a state-by-state basis this ranged from 1% in Tasmania to 50% in New South Wales.
Australian Bureau of Statistics (ABS) data
Sheep turn-off
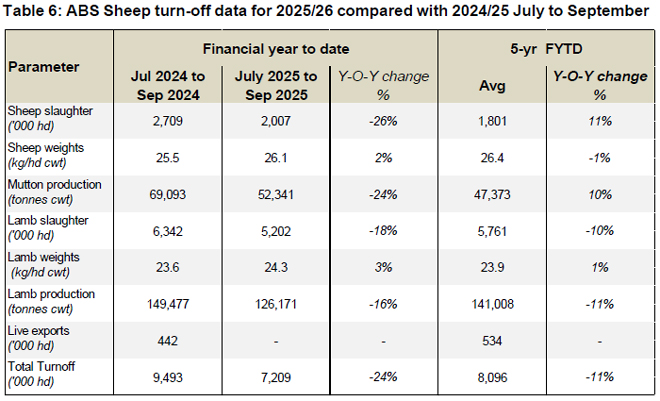
Australian sheep and lamb turn-off statistics during 2025/26 July to September are shown in Table 6:
- There was a 26% decrease in sheep slaughter, and a 18% decrease in lamb slaughter compared with July to September 2024/25.
- Sheep slaughter was 11% above the five-year average with lamb slaughter 10% lower than the five-year average.
- Total turnoff of sheep and lambs for 2025/26 July to September (excluding live export) was 24% lower than 2024/25 and 11% below the five-year average.
Bureau of Meteorology (BoM) seasonal rainfall seasonal outlook
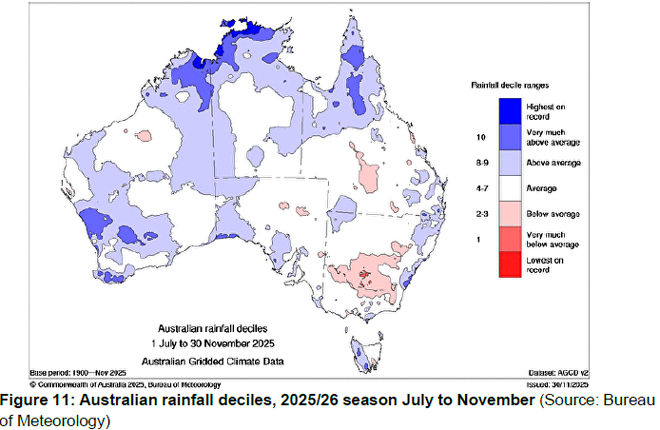
Rainfall deciles during 2025/26 July to November were average to very much above average in Western Australia and average in the key wool producing regions in South Australia, Victoria, Tasmania and northeast New South Wales (Figure 11). Southern regions of New South Wales and Central West Queensland had below average rainfall deciles.
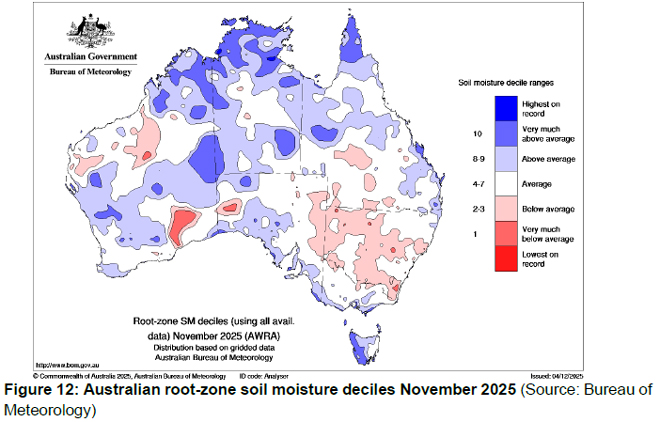
The root-zone soil moisture deciles for November 2025 reflect the seasonal conditions and rainfall between July and November (Figure 12).
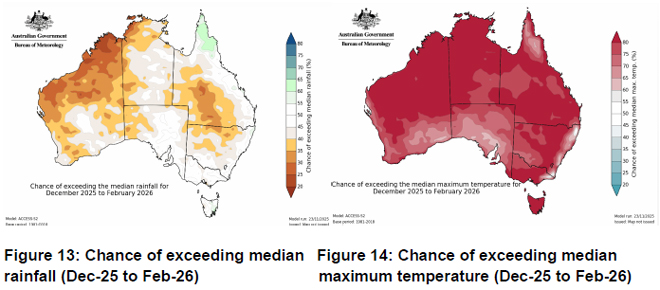
The Bureau of Meteorology’s outlook for December 2025 to February 2026 is for below average median rainfall for parts of the west and inland parts of the east. For most of the east cost of Australia, and across the southern states, there was no clear signal in the rainfall forecast, meaning roughly equal chances of above or below media rainfall to the end of February (Figure 13). Wamer than average days and nights are likely across most of Australia with above average maximum temperatures are likely (60% to greater than 80% chance) for most key wool producing regions (Figure 14).
Results from the MLA and AWI Sheep producers Intentions Survey
The October 2025 Sheep Producer Intentions Survey indicated an increase in wool producers’ outlook, up 38 points from October 2024 to a nett sentiment of +19. Over twice as many wool producers had a positive outlook than a negative one (36% compared with 17% in October 2024). The outlook for the sheepmeat sector continued to strengthen (nett sentiment +78, up 36 points from October 2024). Over four in five (82%) sheepmeat producers reported a positive outlook with just 4% reporting a negative outlook. The improvement in seasonal conditions, commodity prices and international market opportunities have buoyed sheepmeat producer sentiment. The positive outlook was consistent across all producer segments, with Western Australian sheepmeat producers reporting a positive outlook (net sentiment +53, up 55 points from October 2024).
There was a net intention of producers to increase their lamb flocks in the next 12 months: 52% indicated they would increase their lamb flock size; 20% indicated it would remain unchanged; and 28% indicated they would decrease their lamb flock size. The main factors influencing producers plans to increase their lamb flock were their expectation of better lambing results, retention of more ewes, expansion of their sheep operations and an expectation of higher wool prices.
State Committee input
The following provides a summary of seasonal conditions and the wool production estimate for 2025/26 as reported by the AWPFC state committees in December 2025.
New South Wales
Bureau of Meteorology rainfall deciles in key wool producing regions throughout the Riverina and southern regions for July to November were below average with below average root zonesoil moisture deciles. Harsh conditions for sheep and wool production continued through spring and into summer in these regions. The Monaro region is very dry, with little to no agistment available in other regions, a reduction in stock numbers is expected. The season in Central West region is on a knife’s edge, weather conditions over summer and into autumn will heavily impact producer decision making regarding stock numbers. Stock water is a key concern in many regions from the Central West to the southern border as insufficient rainfall has reduced runoff resulting in low dam levels.
Seasonal conditions in the Northern Tablelands are better than 2024/25. Lambing percentages were good, however flystrike is common and worm resistance is an on-going issue. Merino producers continue to transition into cattle or composite lamb production with agents reporting a continued move away from Merino production and are estimating a 20% decline in numbers. The far west region is holding up well with positive producer sentiment.
High meat prices continue to encourage producers to reduce stock numbers to increase cash flow. Many producers have invested heavily in grain and hay to maintain stock since autumn. High skin values mean many sheep (adults and lambs) are being sold in the wool. Low availability of replacement breeding ewes for sale and high cost of this stock will dampen any short-term recovery in sheep numbers. The Committee noted that the biggest reduction in sheep numbers has already occurred.
Low lambing percentages were reported in many regions, particularly in earlier lambing flocks. Later lambing mobs fared better. The lower lambing percentages will reduce the number of young ewes available for joining during 2026. Lower breeding ewe numbers will slow down any natural increase in the New South Wales sheep flock. It will be 18 months to three years before flock numbers will begin to lift and New South Wales shorn wool production to recover. The turnaround will depend on a continued increase in the wool market.
Some reports of mixed farmers transitioning increasing sheep (both Merino and meat breeds) numbers, due to the high costs of cropping inputs and disappointing harvest yields.
An increasing improvement in sentiment among Merino producers (in line with the SPIS October survey) over the past month. Sentiment is more positive in north (both east and west) regions of the state compared to southern regions.
Wool test volumes were inflated by on farm stored wool (crossbred 60% and Merino 40%) coming onto brokers stores and onto the market in response to the wool price rises in September. Some of this was unexpected wool that had been stored on farm for 2 to 4 years. Average cut per head is expected to be lower than 2024/25 due to the harsher seasonal conditions. The New South Wales Committee’s third forecast of shorn wool production for 2025/26 was 98.2 Mkg greasy, down 10.7% on 2024/25.
Victoria
The season in key wool producing regions turned favourable in October. Bureau of Meteorology rainfall deciles remained average to below average across the state through August to September. October and November saw average to above average rainfall deciles. The net result was average rainfall deciles across most of the state from July to November. However, root zone soil moisture deciles remain below average for much of the state following the prolonged drought period. Some Eastern regions remain dry with little ground cover, paddock feed or water.
Sheep numbers in many regions are very low due to reduced water availability. The Committee estimate sheep numbers to be 25% lower. High ewe mortality occurred during lambing with older age cohorts and fail to rear ewes sold to generate cash flow. Significant numbers of ewes carrying 6-months fleece were sold without being shorn due to high skin values and the cost of shearing not covering the value of the fleece. Ewes with 8-months fleece were shorn prior to sale. Any ewes in good condition were sold to generate cash flow.
Producers that rely on ground water (i.e. no access to pipelines or bores) are increasingly concerned about stock water availability over summer. This is particularly true for regions from Ballarat through to Hamilton and may prompt further flock reduction over summer.
The tough seasonal conditions have reduced lambing percentages, particularly for autumn lambing flocks. Spring lambing percentages were higher, but still below average across the state. Fewer ewes than normal were joined for spring lambing.
Shearing contractors report numbers are down by 25%. Spring shearing has been short and sharp due to low sheep numbers. Weeklong runs are now being completed in two to three days. No delays have occurred with shearing. The increase in wool test volumes during October was due to liquidation of on-farm stocks of crossbred wool.
Average cuts per head are expected to be reduced due to the long drought conditions – there has only been 2 good months in the past 12. AWTA Key Test Data show MFD at 20.7 μm, 0.8 μm lower than the 20-year average (21.5 μm). The significant reduction in SS (down 2.2N/ktex) reflects the abrupt turnaround to the season since the end of September. The Victorian Committee’s third forecast of shorn wool production for 2025/26 was 47.10 Mkg greasy, down 20.8% on 2023/24.
Western Australia
An exceptional season through all key wool producing regions. Above average to very much above average rainfall deciles in August and November set up highly favourable conditions for sheep and wool production. The late season has produced good feed, with some green feed persisting in some regions. Cereal and hay crops are expecting good yields. Flystrike is a problem in some regions.
Sheep numbers remain low, but overall producer sentiment towards both sheep and wool production has improved. While high mutton prices have encouraged some producers to continue to reduce numbers, in the past month the bulk of mature sheep sales were made to local producers rather than processors. Most local feedlots are full; others have remaining capacity which they are seeking to fill. Processors are expecting both mutton and lamb to be in short supply during the first half of 2026.
Most operations opting out of sheep production are located in northern and eastern cropping regions. Merino producers in other regions are looking to maintain ewe numbers. Some enquiries from producers seeking to buy breeding ewes or store lambs but current purchase costs are reasonably high. The proportion of Merino ewes mated to Merino rams relative to meat breeds is expected to rise to 60:40 this season, up from 50:50 in recent years (up to 95% of the WA flock has traditionally been Merino). Fewer Merino rams were sold in 2025, but this was due to lower ewe numbers. Further increases in wool prices is expected to boost Merino production.
Adult wool cuts are expected to increase due to the favourable season. Prior to October ewes were sold bare shorn, this has changed since the rise in wool prices. Lambs have been carried longer and shorn one to two months later (generating an additional 0.5 kg fleece weight) to capture increased wool value. Wethers are being moved into confinement systems for summer. Only one live sheep boat has taken sheep from WA this season.
Clips that would normally be held to sell during January and February were tested and sold during September and October to capture the higher wool prices, some broker receivals were up 13% for September and October. Some of these volumes were bales held on-farm rather than current season’s production. This is likely to reduce monthly test volumes in January and February. The usual WA peak of wool testing is still expected during February and March, but reduced from previous seasons. Some reports of producers changing shearing times which may impact receivals and the monthly pattern of wool testing. The Western Australian Committee’s third forecast of shorn wool production for 2025/26 is 41.48 Mkg greasy, down 7.7% on 2024/25.
South Australia
Dry conditions persisted throughout most of the state to the end of September. Above average rainfall deciles fell in the northeast of the state in September with above average to very much above average rainfall deciles in the western half of the state during October. Rainfall deciles from July to November 2025 were average for most of the state and above average for some western regions. A couple of localised areas in the mid-north recorded below average rainfall deciles.
Northern pastoral and rangelands regions remain dry and are waiting on summer rain. Numbers have reduced and lambing percentages were poor. Carryover feed from autumn has allowed some producers to hold onto cull ewes and join as many as possible to counteract the low 2025 lambing rates. If the season remains dry to April, these joined ewes will be sold.
The Mallee region remains challenging for sheep production and cropping. Lentil prices are reducing, with mixed farmers recognising that sheep will generate a return in bad years, but cropping will not and looking to return to sheep production or build sheep numbers. Sheep being sold from this region are moving into the southeast.
In inside regions, rain has increased feed. Producers are looking to increase sheep numbers but are waiting until the feed situation is more certain. There is little talk of switching to alternative breeds.
Wool production in the southeast matches with the AWTA Key Test Data which shows the impact of the poor season on wool quality - a 0.4 μm reduction in MFD to 19.8 μm (the lowest for more than 20 seasons) and year-on-year reductions in the volume of all micron categories tested from <16.5 μm to > 30.6 μm except 23.6 – 24.5 and 24.6 to 26.5 μm categories. SL and SS were both lower than during 2024 July to November. VM has declined by 0.5% (to 2.5%) with a 1.2% reduction in yield.
The season has turned in the southeast since August, pasture production (both grass and clover) has responded well, although it is beginning to dry out. Joining is underway in preparation for May lambing. There has been some change from cropping into sheep production due to the high input costs of sowing crops. The first on-property ewe and ewe lamb sales have been positive. Many producers are still opting to convert to composites to produce a self-replacing flock rather than purchase a traditional first cross, but there is still ongoing support for the first cross enterprises who are in the system.
No change was made to the August forecast as the committee reduced the SA forecast in August to better reflect the seasonal conditions at that time. The South Australian Committee’s third forecast of shorn wool production for 2025/26 is 39.83 Mkg greasy, down 15.8% on 2024/25.
Tasmania
Dry conditions persisted in key wool growing regions to the end of October. Average to above average rain deciles were recorded in the western half of the state from September through to November. Average rainfall deciles from July to November in key wool production regions. The late spring has meant the season has returned to average levels, with Bureau of Meteorology root zone soil moisture deciles sitting at average to above average in October. Northern regions have fared better than southern with the latter regions remaining relatively dry. Reports of increased broadleaf weeds in pasture.
AWTA Key Test Data for mean fibre diameter, staple length and staple strength were very similar to July to November 2024 indicating similar to slightly higher level of per head production.
Sheep numbers are expected to remain near average levels, with no large movements expected. Sheep and lamb slaughter for the September 2025 quarter were down 13 and 17 % respectively compared to 2024. Strong lamb prices and their positive impact on cash flow have underpinned sheep numbers. Producers have confidence that high lamb prices will continue.
Some signs of optimism among committed wool producers. Producer sentiment is expected to remain positive into 2026. Merino ram sales have been average. There have been no moves either toward or away from Merino production. The cost of inputs is disproportionally impacting smaller producers (30 – 80 bale clips) as they don’t have the economy of scale to spread the costs over a larger production base. These smaller producers are the most likely to make a change to prime lamb production.
Merino producers are not expected to move away from Merino production, but to join terminal rams to a proportion of their Merino ewes to capitalise on the higher lamb prices. However, this strategy is short term as undertaking it more than twice will begin to reduce the proportion of young replacement Merino ewes and reduce future Merino wool production.
Crossbred lamb production is becoming a more attractive strategy to deal with an increasingly variable climate as it is easier to offload and sell crossbred lambs rather than carry Merino lambs through summer. The Tasmanian Committee’s third forecast of shorn wool production for 2025/26 is 8.71 Mkg greasy, down 5.4% on 2024/25.
Queensland
Average rainfall deciles through most of the state, except for some regions which were below average, producing average root zone soil moisture deciles. In the key wool producing regions, the season has been patchy with isolated storms producing variable rainfall across districts. Producers are looking for the January to March break to the season.
There is a large body of low protein sheep feed in key regions. The lack of protein may have negatively impacted on ovulation rates; this is expected to translate into reduced pregnancy scanning rates.
Producers are increasingly moving from a wool enterprise to a wool and sheep enterprise and making decisions based on wool and sheep returns. Medium wool enterprises (19.5 to 21 μm) generally have a positive sentiment (due to the increased wool prices) and are looking to consolidate and increase numbers. Remaining sheep producers are dedicated to wool production. Superfine and fine (17.5 – 18.5 μm) producers have not had a price rally, are less positive and still to decide on future sheep numbers and production levels.
AWTA Key Test Data show small changes in MFD, SL and SS indicative of similar per head production to 2024/25. The move to shedding breeds in the central west noted during August, appears to have stalled. This is due to the cost of the breed change (i.e. the price of shedding ewes and freight costs for those ewes relative to the value of Merino ewes) and uncertainty regarding lambing percentages of shedding ewes and the ability to finish lambs.
Reports of some orders for Merino weaner wethers, however prices are too high at present to see them fulfilled. Wild dogs remain an issue in regions where exclusion fencing was damaged during the March 2025 flood event. In other regions control of dogs within exclusion fenced areas remains problematic. This is affecting joining percentages and lamb survival. Feral pigs are also an on-going issue.
Access to labour continues to be difficult. Producers are responding by reducing flock numbers or managing the timing of sheep husbandry events to coincide with the availability of FIFO labour. Good returns continue to be made from goats. They are being used to control regrowth in some regions but can damage sheep country if used for this purpose for extended duration of time. The Queensland Committee’s third forecast of shorn wool production for 2025/26 is 8.20 Mkg greasy, down 11.2% on 2024/25.
Appendix
Table A1: Comparison of shorn wool production in 2024/25 against the 2023/24 season and the third forecast for 2025/26 against the 2024/25 season
At their September 2022 meeting, the AWPFC National Committee resolved to include a clean estimate of shorn wool production based on the yield (%, Schlumberger dry top and noil yield) from the AWTA key test data for each complete season.
Historical Australian Production Figures
The tables below provide historical sheep shorn numbers, wool production, fleece weight and micron share statistics since 1991/92 for background information.
Table A2: Australian wool production statistics since 1991/92
At their September 2022 meeting, the AWPFC National Committee resolved to include a clean estimate of shorn wool production for each full season based on the yield (%, Schlumberger dry top and noil yield) from the AWTA key test data for that season.
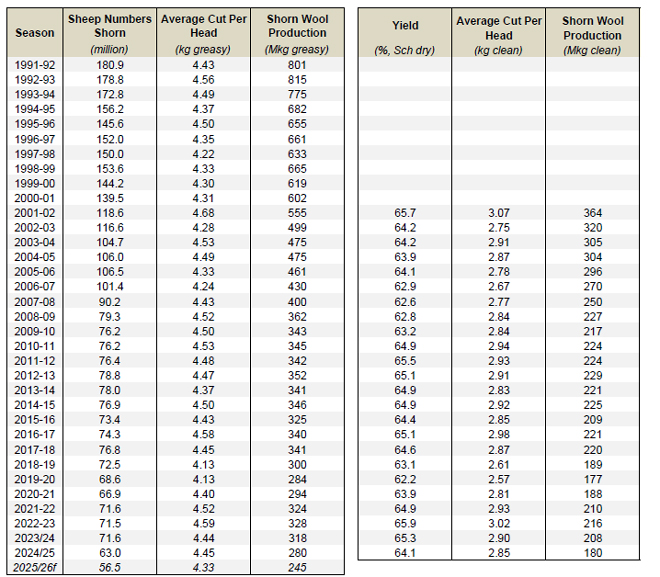
Explanation of revised AWPFC data series
At the December 2005 meeting, the National Committee made the decision to collate and review the key variables (shorn wool production, cut per head, number of sheep shorn) used in the committee from the available industry sources and to create a consistent historical data series at both a state and national level. This was required as some differences existed between industry accepted figures and the AWPFC data series and to ensure a consistent methodology over time. This process resulted in changes to the parameters ‘average cut per head’ and the ‘number of sheep shorn’ for some seasons at both a state and national level.
Modus operandi for the Australian Wool Production Forecasting Committee
The Australian Wool Production Forecasting Committee draws together a range of objective data and qualitative information to produce consensus-based, authoritative forecasts four times a year for Australian wool production.
The Committee has a two-level structure, with a National Committee considering information and advice from state committees. It is funded by Australian Wool Innovation Limited, which also provides a representative in the role of the Chairman of the National Committee.
The National and state committees comprise wool producers, wool brokers, exporters, processors, private treaty merchants, AWEX, AWTA, ABARES, ABS, MLA, state departments of Agriculture, sheep pregnancy scanners and AWI.
The Committee releases its forecasts in the forms of a press release and a report providing the detailed forecasts, historical data and commentary on the key drivers of the forecasts.