Market intelligence report
The first seven months of the 2023/24 selling season saw the EMI in AUD increase by 4% from 1126ac/clean kg to be 1171ac/clean kg by 1 February 2024.
Season production by micron
Australian Wool Testing Authority (AWTA) key test data at the midpoint of the season indicates there has been a significant change to the micron distribution of the national clip during this season compared to the micron distribution at the same point in last year’s season. There has been a surge in sale lots tested at both extremities of the data. See Table 1.
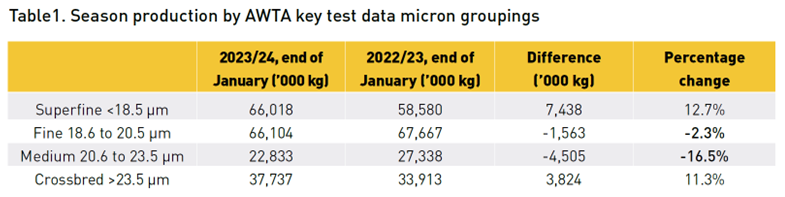
A large percentage of production gains has been recorded at the finest end (less than 18.5 micron) of the spectrum, with 12.7% more wool tested, and the broadest end (greater than 23.5 micron) of the clip, with 11.3% more wool tested.
Those gains have come at the expense of the dramatic reduction of -16.5% of wools tested being in the medium wool sector between 20.6 and 23.5 micron. Fine wools of 18.6 to 20.5 micron have remained relatively stable compared to the first six months of last season, but still more than 2% lower than at the same time last year.
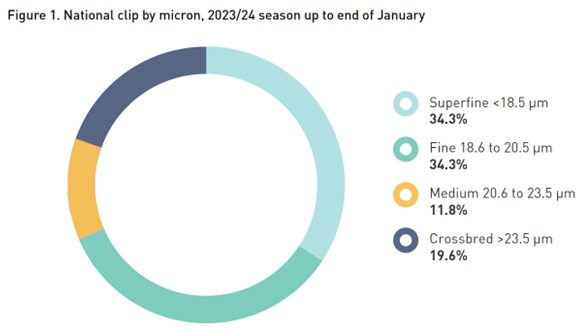
Merino wools finer than 20.5 micron make up almost 70% of the national clip as at 1 February 2024. See Figure 1.
Wool price movements
EMI in AUD:
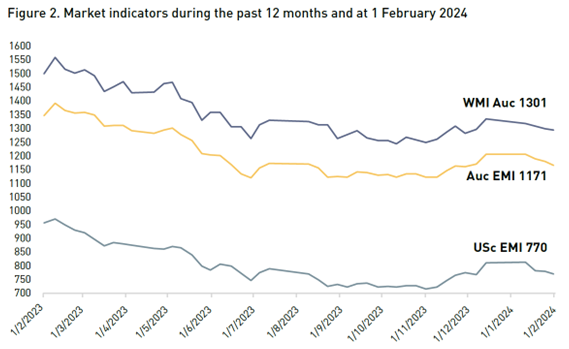
The 2023/24 season has seen the Eastern Market Indicator (EMI) in AUD improve from 1126ac/clean kg at the start of the selling season in July to be 1171ac/clean kg by the end of week 31 (1 February 2024). This is a gain during the season of 45ac or 4.0% in Australian dollar terms. The AUD EMI has averaged 1156ac/clean kg for the first seven months of the season.
During the past 12 months, the AUD EMI has fallen by 185ac from 1356ac/clean kg on 1 February 2023 to 1171ac on 1 February 2024, an overall 13.6% reduction in AUD value.
EMI in USD:
The USD EMI has advanced 22usc/clean kg from 748usc/clean kg at the start of the 2023/24 season in July to close week 31 (1 February 2024) at 770usc/clean kg. This is a seasonal gain in US dollar terms of 2.9%. The USD EMI has averaged 753usc/clean kg for the first seven months of the season.
During the past 12 months, the USD EMI has fallen by 188usc from 958usc to 770usc on 1 February 2024, a 19.6% fall in the USD value of wool.
WMI in AUD:
The 2023/24 season has seen the Western Market Indicator (WMI) in AUD increase 30ac from the season opening price of 1271ac/clean kg to be 1301ac/clean kg by the end of week 31 (1 February 2024). This is gain during the season of 2.4% in Australian dollar terms. The AUD WMI has averaged 1295ac/clean kg for the first seven months of the season.
The AUD WMI has depreciated from 1510ac to 1301ac during the past 12 months. This is 209ac or 13.8% lower in the WMI in Australian dollar values.
Export destinations of Australian wool
At the completion of the first third of the 2023/24 season, the Australian Bureau of Statistics (ABS) reported that the percentage of Australian wool exported to China during that four-month period was even greater than the annual percentage of last year by volume (82.6% last year total). The season so far has seen 84.32% of all wool exported going into China by weight. Even so, the total weight is 4.4% lower than at the same time last season (by the end of October).
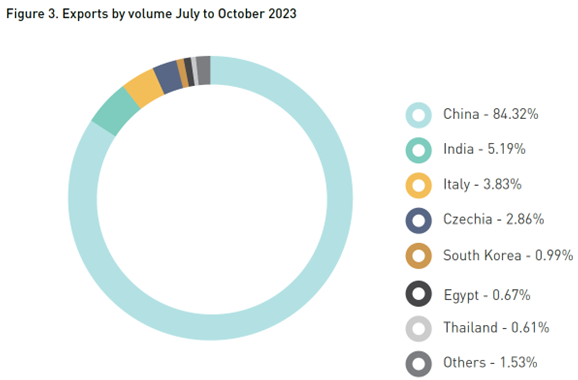
The lack of competition that has been reported for the first six months of the 2023/24 season from both the European and sub-continent users is continuing and borne out by the fall in exports to both India and, more concerningly, Italy. These importing nations are running about 23.2% lower (India) and 20.5% lower (Italy) than the same reporting period last season.
While there has been a drop off in exports to Italy by volume, the real impact comes from the drop off in value of their imports. At the end of the first four months of the current season, the Italian import value represented 7.14% of the total wool export value, when you would normally expect to see Italy import 10 to 12% of Australian wool by value.
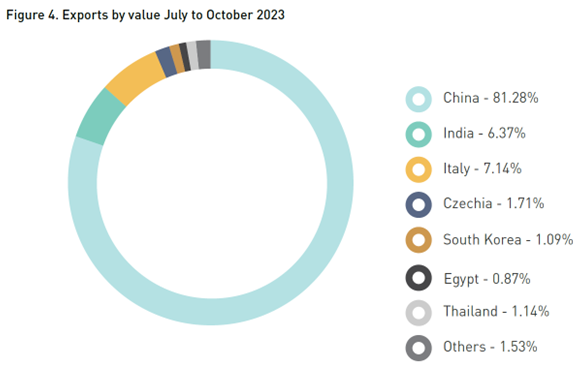
Just seven export destinations make up 99.6% of wool exports in any form by value, and those same seven destinations account for 98.5% of volume.
AWI market intelligence for woolgrowers
In addition to this Market Intelligence Report provided each quarter in Beyond the Bale, AWI provides several other regular market intelligence services that are available FREE to woolgrowers, including:
Weekly Price Reports (during sale weeks), which include weekly EMI and WMI price movements, currency movements, the number of bales offered and sold, as well as weekly commentary from AWI on the markets.
Monthly Market Intelligence Reports that provide insights into economic, finance and trade issues affecting global demand for wool, and what this means for the Australian wool industry.
Graphical display of market information on Wool.com, including:
- Micron price – you can select from a full range of microns, sold in Sydney, Melbourne and Fremantle.
- Market Indicator – you can select to display AUD, USD, CNY or EUR.
- Offering – displays bales offered and bales sold.
- Currency movements – you can select to display AUD/USD, AUD/CNY or AUD/EUR.
- Forecast of bales sold – displays previous season, current season, current week and forecast.
For the first four categories above, you can select to display data from 3 months to 3 years ago.
Australian Wool Production Forecasting Committee reports that provide detailed estimates of sheep numbers, sheep shorn, average cut per head and wool production. The reports are produced three times each year.
Sheep Producer Intentions Survey which are conducted three times each year jointly with MLA. The survey results are used to create regional, state and national wool and sheepmeat industry data which enables the industry to better manage the supply chain and meet producer and customer expectations.
More information: View the above market intelligence information at www.wool.com/marketintel or subscribe at www.wool.com/subscribe to receive the information by email and/or SMS. You can unsubscribe from the service at any time.